
Results


At G Ratings, we conducted a statewide survey in Texas to measure electoral preferences and the political climate ahead of the 2026 general election. The results show competitive contests for governor and U.S. Senate, while the race for Texas’ 15th Congressional District also records a narrow difference between the leading candidates.
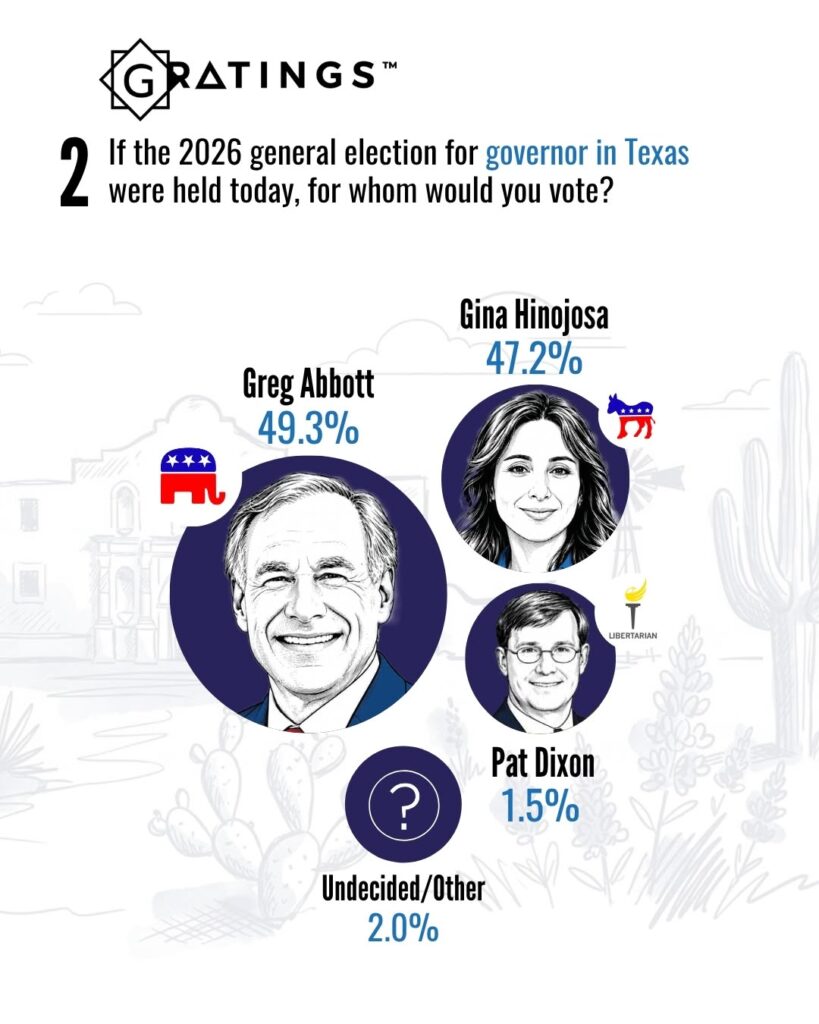
In the gubernatorial race, Republican Greg Abbott receives 49.3% and Democrat Gina Hinojosa 47.2%, a difference of 2.1 percentage points. Libertarian Pat Dixon receives 1.5%, while 2.0% selected another option or remain undecided. The three candidates are certified for Texas’ November 3 general election ballot.
Greg Abbott and Gina Hinojosa separated by 2.1 points
At G Ratings, we surveyed Texas voters about how they would vote if the 2026 general election for governor were held today.
The results are:
- Greg Abbott, Republican: 49.3%
- Gina Hinojosa, Democratic: 47.2%
- Undecided/Other: 2.0%
- Pat Dixon, Libertarian: 1.5%
Neither of the two major-party candidates reaches 50% in this measurement. The difference between Abbott and Hinojosa stands at 2.1 percentage points during the survey’s fieldwork period.
James Talarico and Ken Paxton in competitive U.S. Senate contest
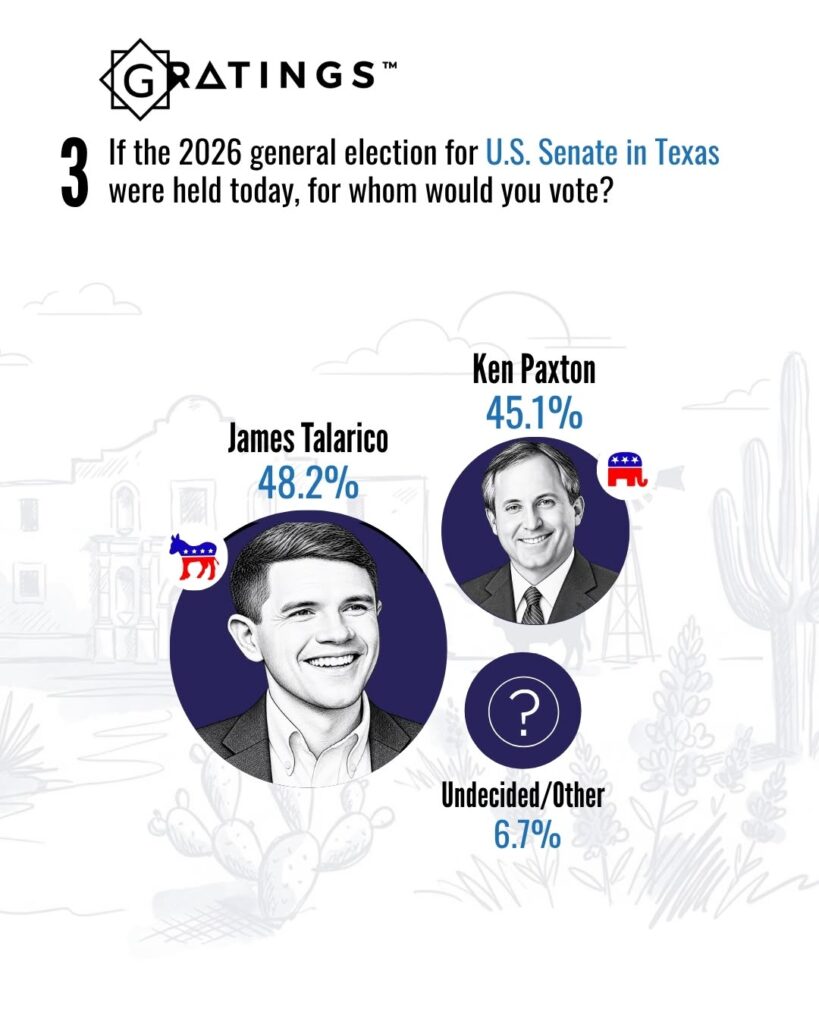
At G Ratings, we also surveyed voters about the 2026 general election for U.S. Senate in Texas.
Democrat James Talarico receives 48.2%, while Republican Ken Paxton registers 45.1%. Another 6.7% selected another option or remain undecided. Both Talarico and Paxton are certified candidates for the November general election.
- James Talarico, Democratic: 48.2%
- Ken Paxton, Republican: 45.1%
- Undecided/Other: 6.7%
The difference between the two candidates is 3.1 percentage points in the G Ratings measurement.
The undecided and other segment represents more than six percent of respondents, making it an important part of the current electoral picture.
Bobby Pulido and Monica De La Cruz compete in Texas’ 15th District
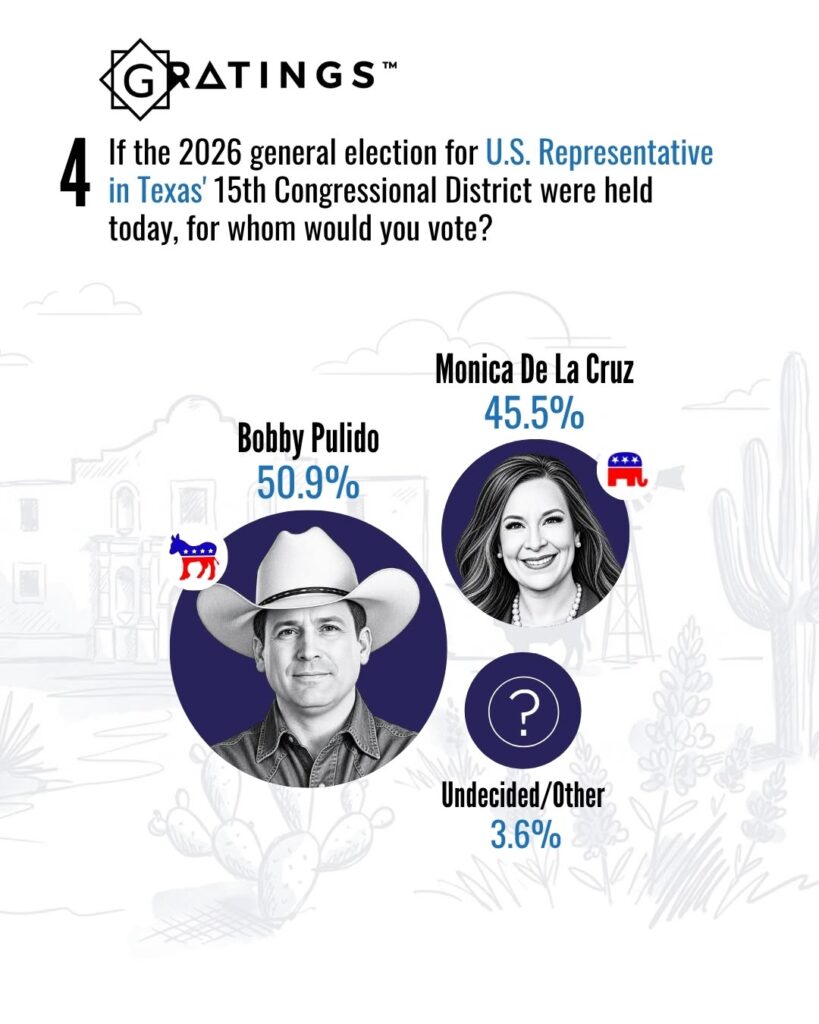
We also measured voter preferences in the race for U.S. Representative in Texas’ 15th Congressional District.
The survey places Democrat Bobby Pulido at 50.9% and Republican Monica De La Cruz at 45.5%, while 3.6% selected another option or remain undecided.
- Bobby Pulido, Democratic: 50.9%
- Monica De La Cruz, Republican: 45.5%
- Undecided/Other: 3.6%
The difference between Pulido and De La Cruz is 5.4 percentage points in this survey.
Republicans represent the largest political affiliation group
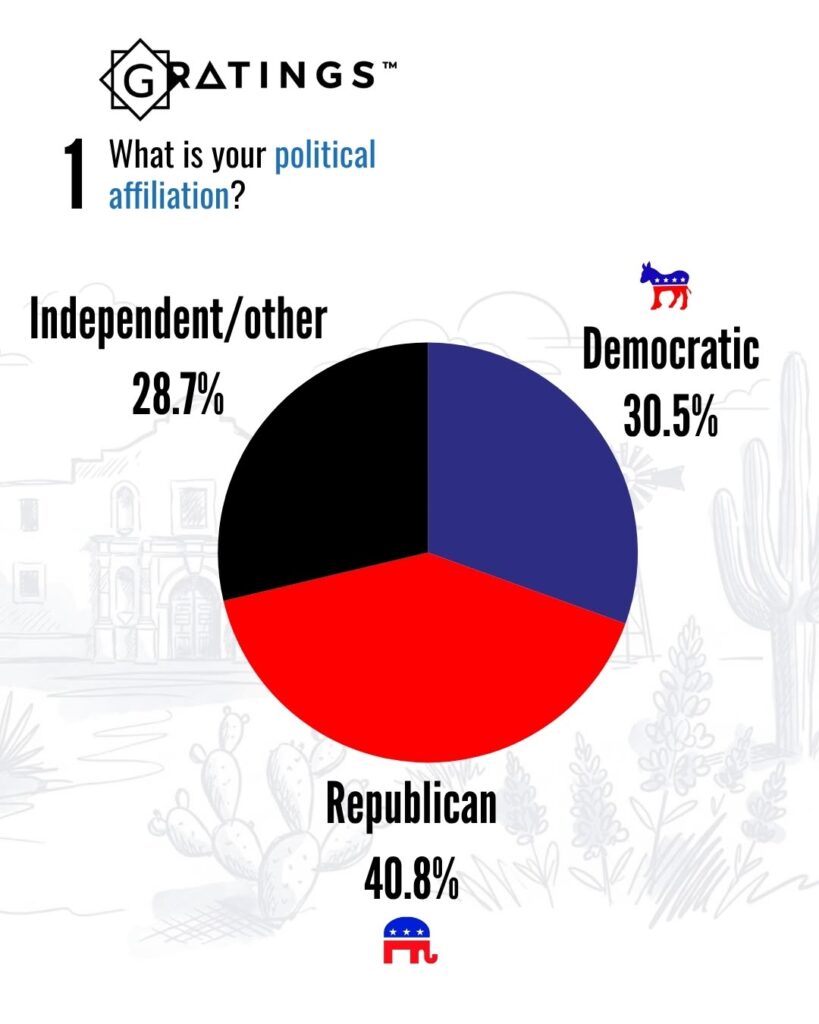
At G Ratings, we asked respondents to identify their political affiliation. Republicans represent the largest group in the sample, followed by Democrats and independent or other voters.
- Republican: 40.8%
- Democratic: 30.5%
- Independent/Other: 28.7%
Independent and other voters account for nearly three in ten respondents, providing additional context for interpreting the statewide electoral measurements.
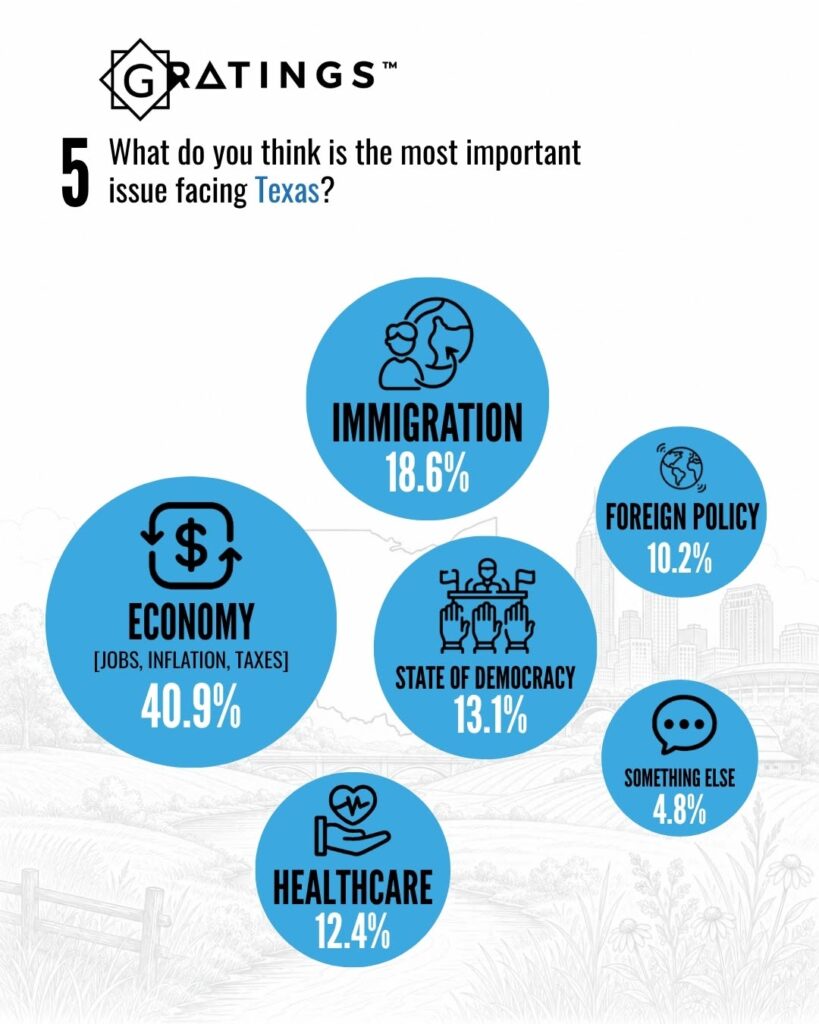
Economy is the most important issue for Texas voters
Beyond electoral preferences, we asked Texans to identify the most important issue facing the state.
The economy, including jobs, inflation and taxes, ranks first by a substantial margin.
- Economy — jobs, inflation and taxes: 40.9%
- Immigration: 18.6%
- State of democracy: 13.1%
- Healthcare: 12.4%
- Foreign policy: 10.2%
- Something else: 4.8%
More than four in ten respondents identify the economy as the most important issue facing Texas, making it the highest-ranked concern in the survey.
Immigration ranks second at 18.6%, followed by the state of democracy at 13.1% and healthcare at 12.4%.
Texas survey reflects a diverse electorate
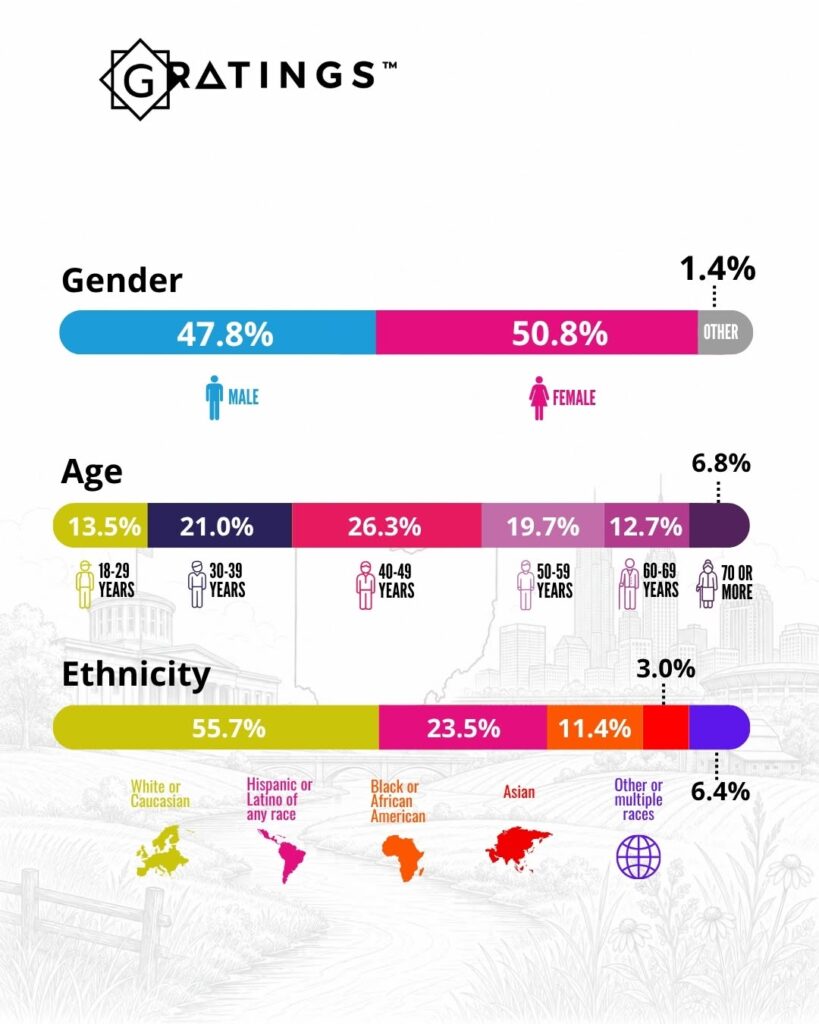
The G Ratings survey included respondents across different age, gender and ethnic groups.
By gender, the sample was composed of:
- Female: 50.8%
- Male: 47.8%
- Other: 1.4%
By age, respondents were distributed as follows:
- 18–29 years old: 13.5%
- 30–39 years old: 21.0%
- 40–49 years old: 26.3%
- 50–59 years old: 19.7%
- 60–69 years old: 12.7%
- 70 years and older: 6.8%
The largest age group in the study was respondents between 40 and 49 years old, representing 26.3% of the sample.
By ethnicity, 55.7% identified as White or Caucasian, 23.5% as Hispanic or Latino of any race, 11.4% as Black or African American, 3.0% as Asian and 6.4% as other or multiple races.
G Ratings surveyed 825 Texas voters
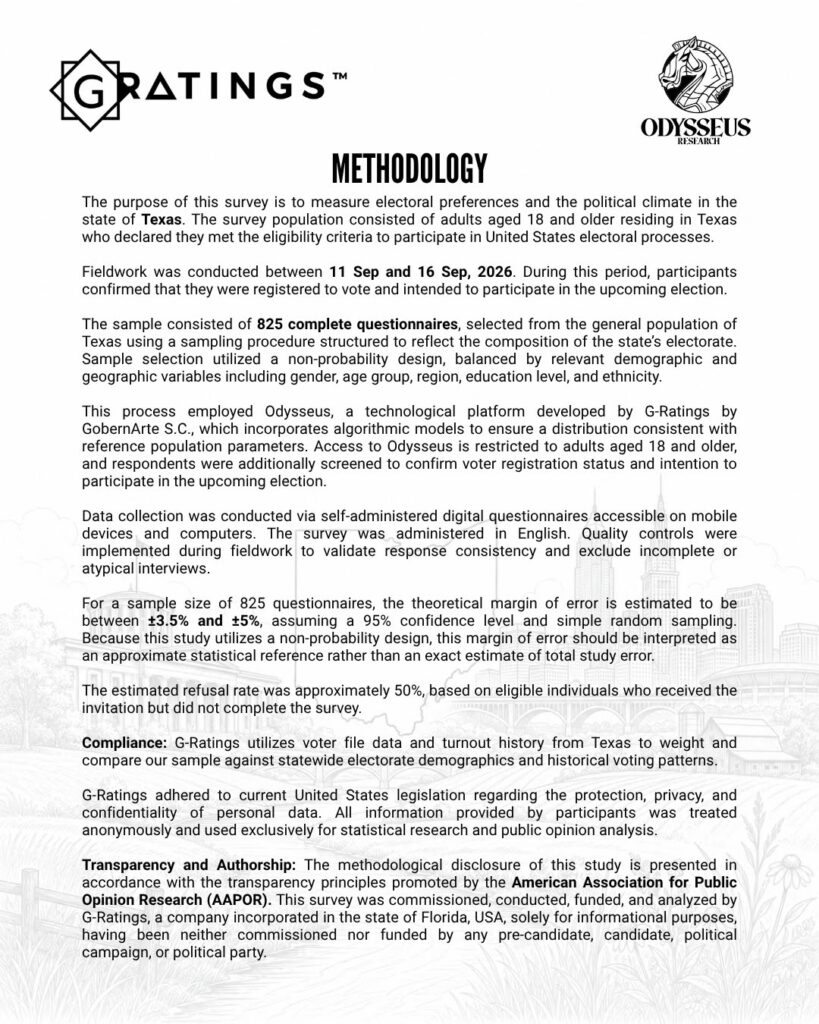
At G Ratings, we surveyed 825 adults aged 18 and older residing in Texas who declared that they met the eligibility requirements to participate in United States electoral processes.
Fieldwork was conducted from September 11 through September 16, 2026. Participants confirmed that they were registered to vote and intended to participate in the upcoming election.
The study consisted of 825 completed questionnaires and used a non-probability sampling design balanced according to relevant demographic and geographic variables, including gender, age group, region, education level and ethnicity.
Data collection was conducted through self-administered digital questionnaires accessible on mobile devices and computers.
The study employed Odysseus, the technological platform used by G Ratings to administer questionnaires, apply respondent screening and support distribution according to reference population parameters.
G Ratings also used Texas voter file data and turnout history to weight and compare the sample against statewide electorate demographics and historical voting patterns.
For the sample of 825 questionnaires, the study reports a theoretical margin of error between ±3.5% and ±5% at a 95% confidence level. Because the research uses a non-probability design, this range should be interpreted as an approximate statistical reference rather than an exact estimate of total survey error.
G Ratings presents a snapshot of Texas voter sentiment
At G Ratings, we present this September study as a measurement of voter preferences during the fieldwork period, not as a prediction of the final election results.
The survey records close differences in the races for governor and U.S. Senate, while the measurement in Texas’ 15th Congressional District also shows a competitive contest.
At the same time, the results show that the economy is the most frequently selected concern among surveyed Texas voters, followed by immigration, the state of democracy and healthcare.