
Results


Xavier Becerra Leads the Field, Followed by Steve Hilton, in a Competitive Early Race for Governor of California
At G Ratings, we conducted a statewide public opinion survey to measure the political climate ahead of the 2026 California Governor primary election. We surveyed adults aged 18 and older residing in California who confirmed that they were registered to vote and intended to participate in the upcoming election.
In this study, we present the main findings on voter preference, political affiliation, and the issues Californians consider most important as the state prepares for a highly competitive electoral process.
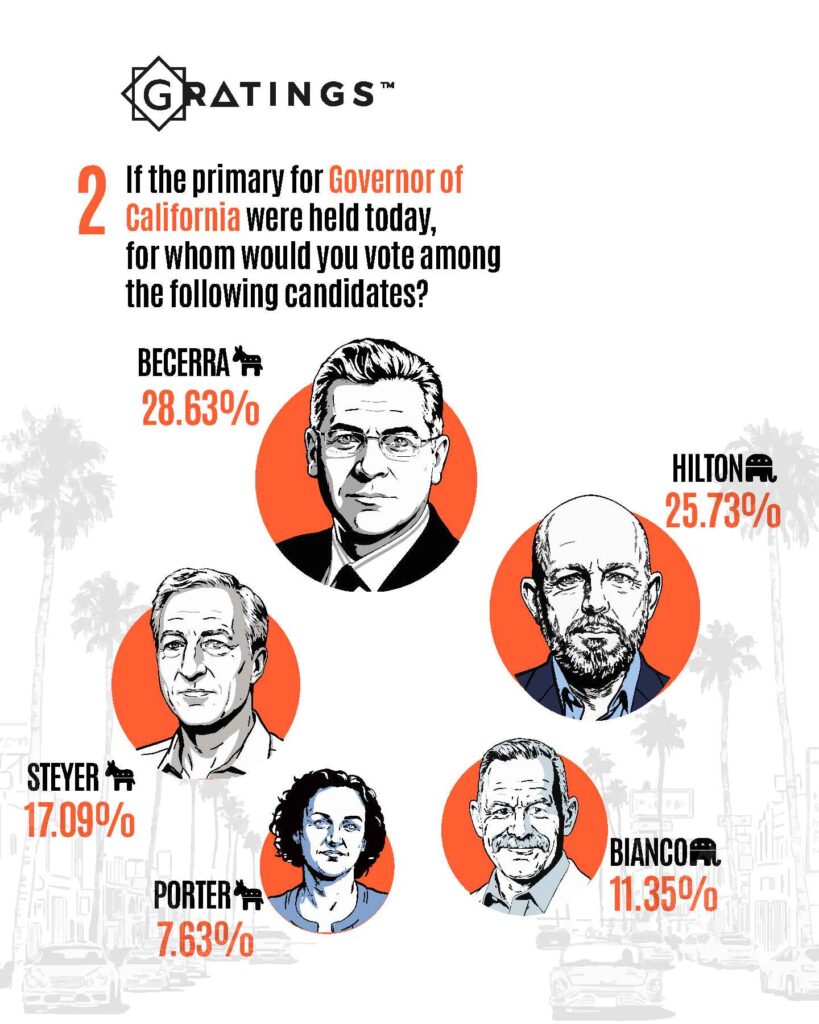
The results show Xavier Becerra leading the race with 28.63%, followed by Steve Hilton with 25.73%. Tom Steyer appears in third place with 17.09%, while Chad Bianco records 11.35% and Katie Porter reaches 7.63%.
Voter Preference in the California Governor Primary
If the primary election for Governor of California were held today, respondents expressed the following voting preferences:
- Xavier Becerra: 28.63%
- Steve Hilton: 25.73%
- Tom Steyer: 17.09%
- Chad Bianco: 11.35%
- Katie Porter: 7.63%
These results suggest an early contest led by Becerra, with Hilton maintaining a close second position and Steyer remaining a relevant contender in the race.
Political Affiliation of Respondents
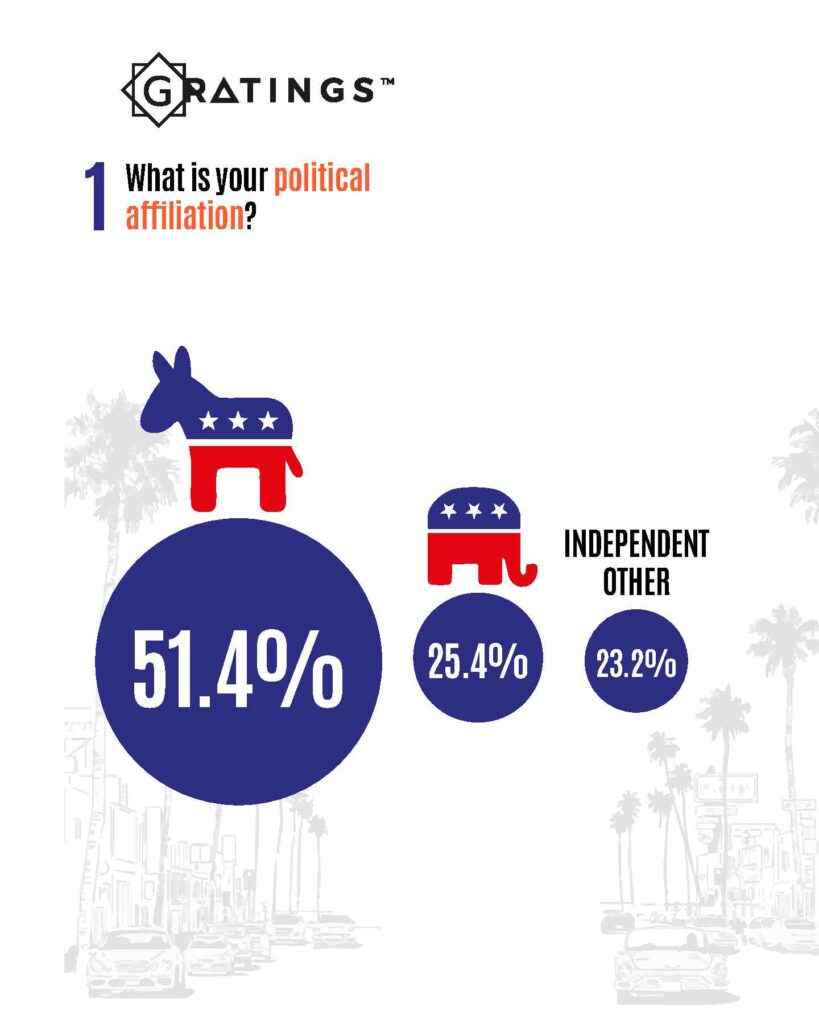
The survey also measured the political affiliation of participants. The results show a Democratic-leaning sample, followed by Republican voters and independent or other affiliations.
- Democratic affiliation: 51.4%
- Republican affiliation: 25.4%
- Independent or other affiliation: 23.2%
This distribution provides context for understanding the current preferences and political environment among California voters included in the study.
Main Issues Facing California
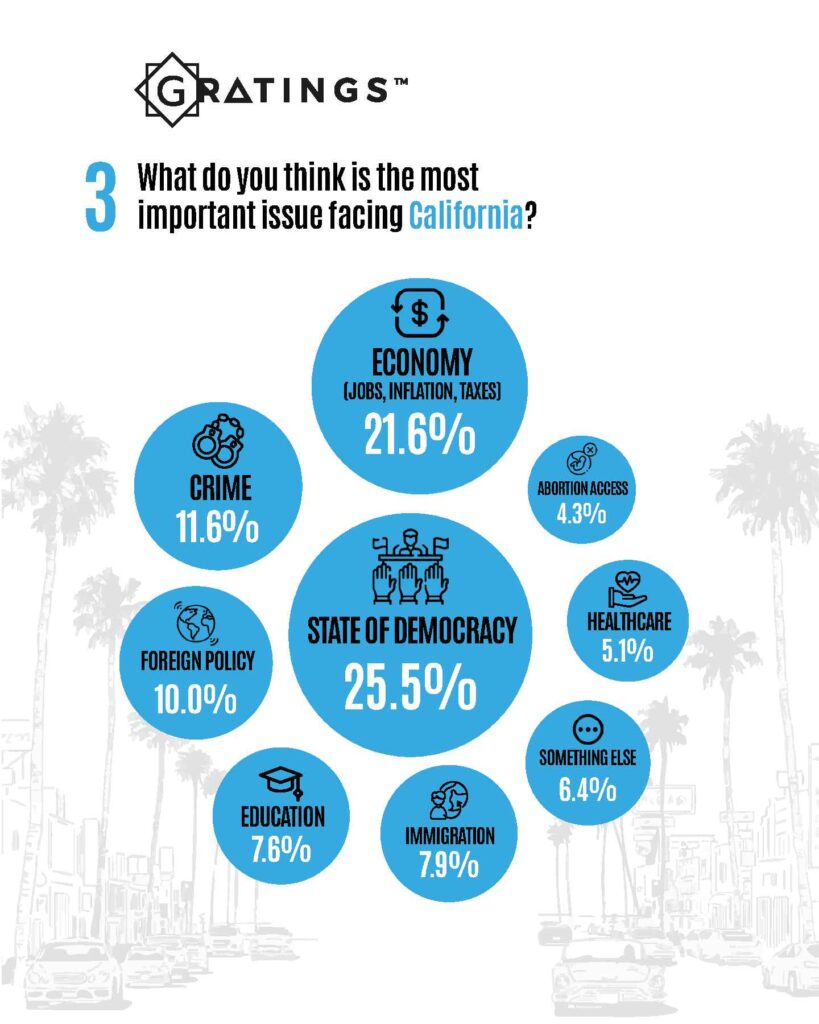
At G Ratings, we also asked respondents what they believe is the most important issue facing California today. The results show that the state of democracy and the economy are the top concerns among voters.
- State of democracy: 25.5%
- Economy, jobs, inflation, and taxes: 21.6%
- Crime: 11.6%
- Foreign policy: 10.0%
- Immigration: 7.9%
- Education: 7.6%
- Something else: 6.4%
- Healthcare: 5.1%
- Abortion access: 4.3%
The data indicates that voters are primarily focused on institutional stability, economic conditions, public safety, and broader national issues that influence the political conversation in California.
Demographic Profile of the Survey
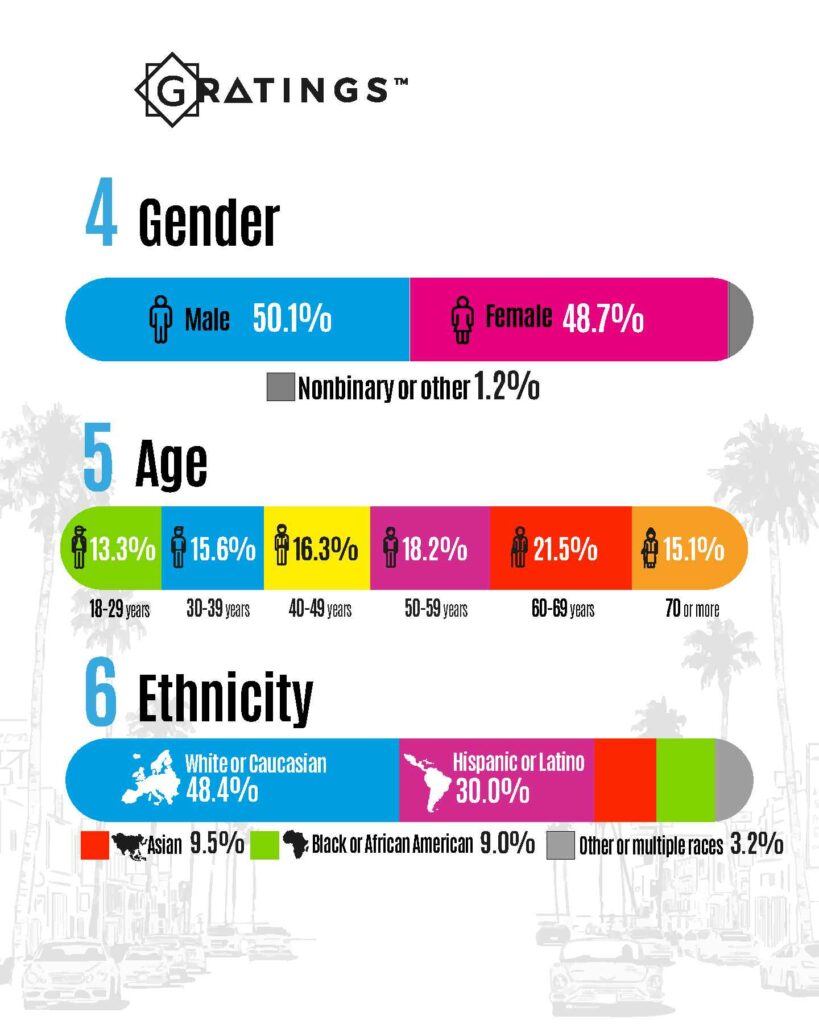
The survey included a balanced demographic profile across gender, age, and ethnicity.
By gender, respondents were distributed as follows:
- Male: 50.1%
- Female: 48.7%
- Nonbinary or other: 1.2%
By age group, the results were:
- 18–29 years: 13.3%
- 30–39 years: 15.6%
- 40–49 years: 16.3%
- 50–59 years: 18.2%
- 60–69 years: 21.5%
- 70 years or older: 15.1%
By ethnicity, the survey recorded the following composition:
- White or Caucasian: 48.4%
- Hispanic or Latino: 30.0%
- Asian: 9.5%
- Black or African American: 9.0%
- Other or multiple races: 3.2%
Methodology
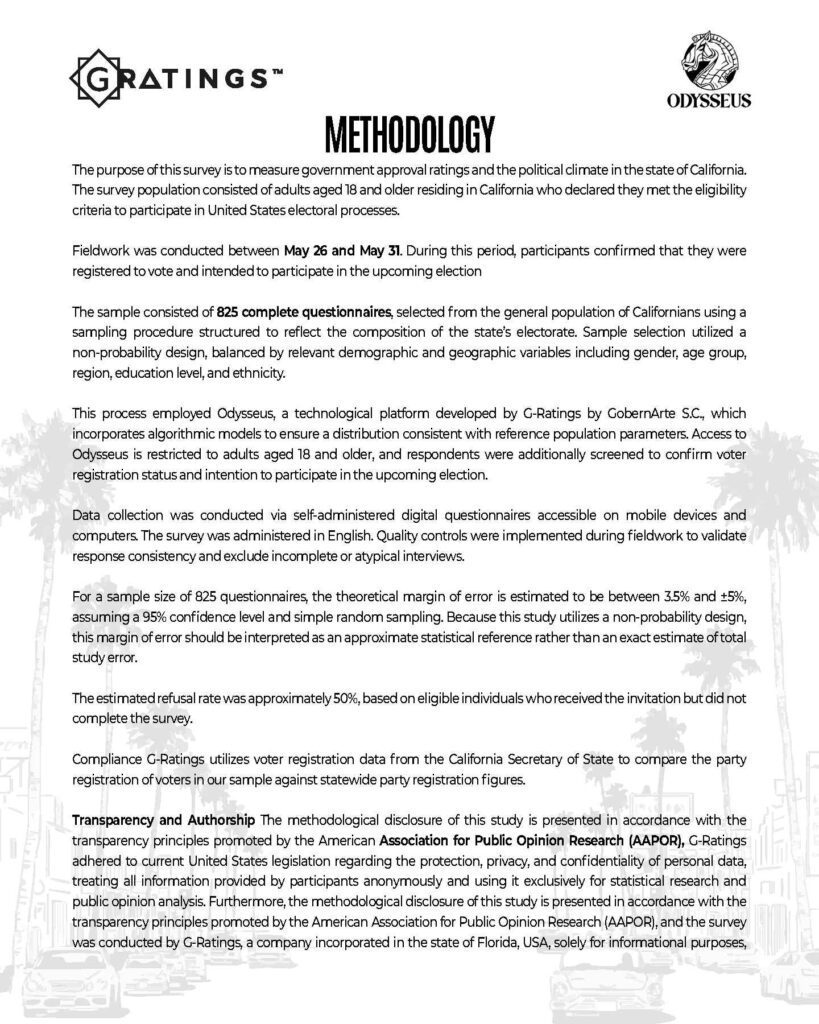
At G Ratings, we conducted this survey among 825 complete questionnaires from adults aged 18 and older residing in California. Fieldwork was carried out between May 26 and May 31.
Participants confirmed that they were registered to vote and intended to participate in the upcoming election. The survey was administered through self-administered digital questionnaires accessible on mobile devices and computers.
The study used a non-probability sample design, balanced by relevant demographic and geographic variables, including gender, age group, region, education level, and ethnicity.
This process employed Odysseus, a technological platform developed by G Ratings by GobernArte S.C., which incorporates algorithmic models to ensure a distribution consistent with reference population parameters.
For a sample size of 825 questionnaires, the theoretical margin of error is estimated between 3.5% and ±5%, assuming a 95% confidence level and simple random sampling. Since this study uses a non-probability design, the margin of error should be interpreted as an approximate statistical reference rather than an exact estimate of total study error.
The estimated refusal rate was approximately 50%.