
Results



At G Ratings, we conducted a statewide survey to measure electoral preferences and the political climate in Georgia ahead of the 2026 general election.
The September measurement shows Rick Jackson with 47.5% in the race for governor, while Keisha Lance Bottoms registers 45.3%. Another 7.2% selected Other/None.
The difference between Jackson and Bottoms in the G Ratings measurement is 2.2 percentage points, reflecting the preferences expressed by respondents during the fieldwork period.
G Ratings presents voting preferences for Georgia governor
At G Ratings, we surveyed Georgia residents to determine how they would vote if the 2026 general election for governor were held at the time of the study.
The results were:
- Rick Jackson: 47.5%
- Keisha Lance Bottoms: 45.3%
- Other/None: 7.2%
The results provide a snapshot of electoral preferences in Georgia during the September 2026 measurement and reflect voter sentiment during the period in which the survey was conducted.
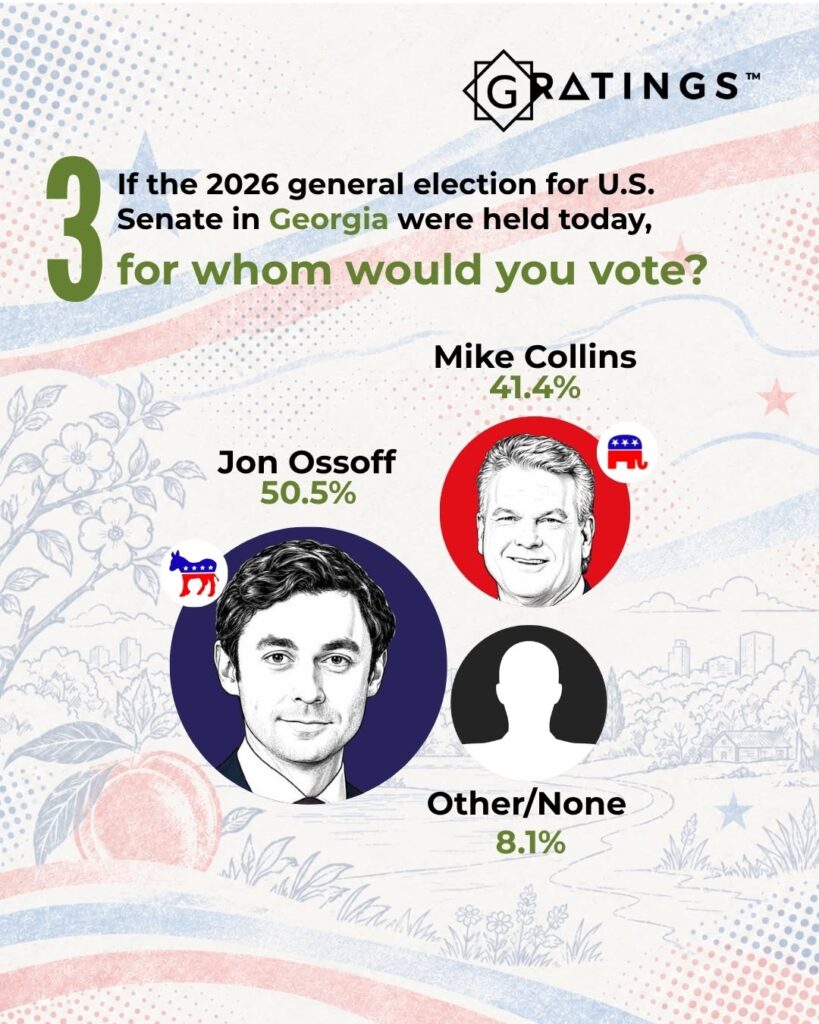
Jon Ossoff registers 50.5% in the U.S. Senate matchup
At G Ratings, we also surveyed participants about their voting preferences in the 2026 general election for U.S. Senate in Georgia.
The results were:
- Jon Ossoff: 50.5%
- Mike Collins: 41.4%
- Other/None: 8.1%
The measurement places Ossoff 9.1 percentage points ahead of Collins among respondents participating in the study.
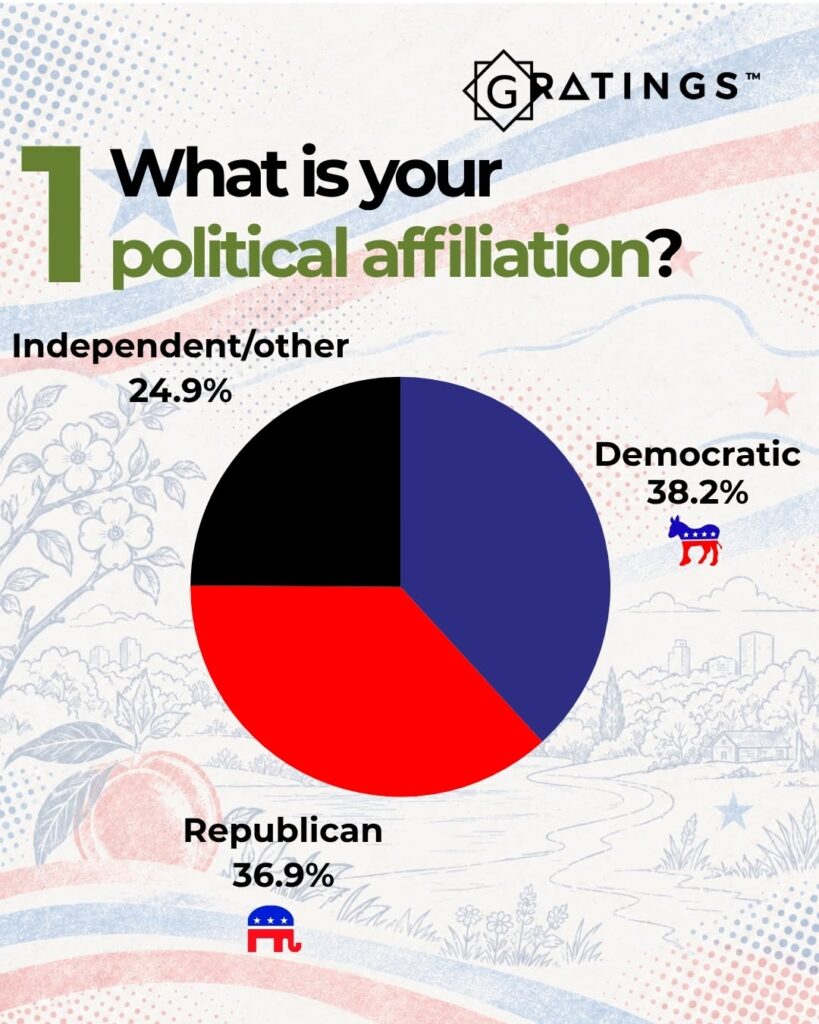
Democrats represent 38.2% of respondents
At G Ratings, we also asked participants to identify their political affiliation as part of the statewide survey.
The results were:
- Democratic: 38.2%
- Republican: 36.9%
- Independent/Other: 24.9%
The figures provide additional context regarding the political composition of the respondents included in the Georgia measurement.
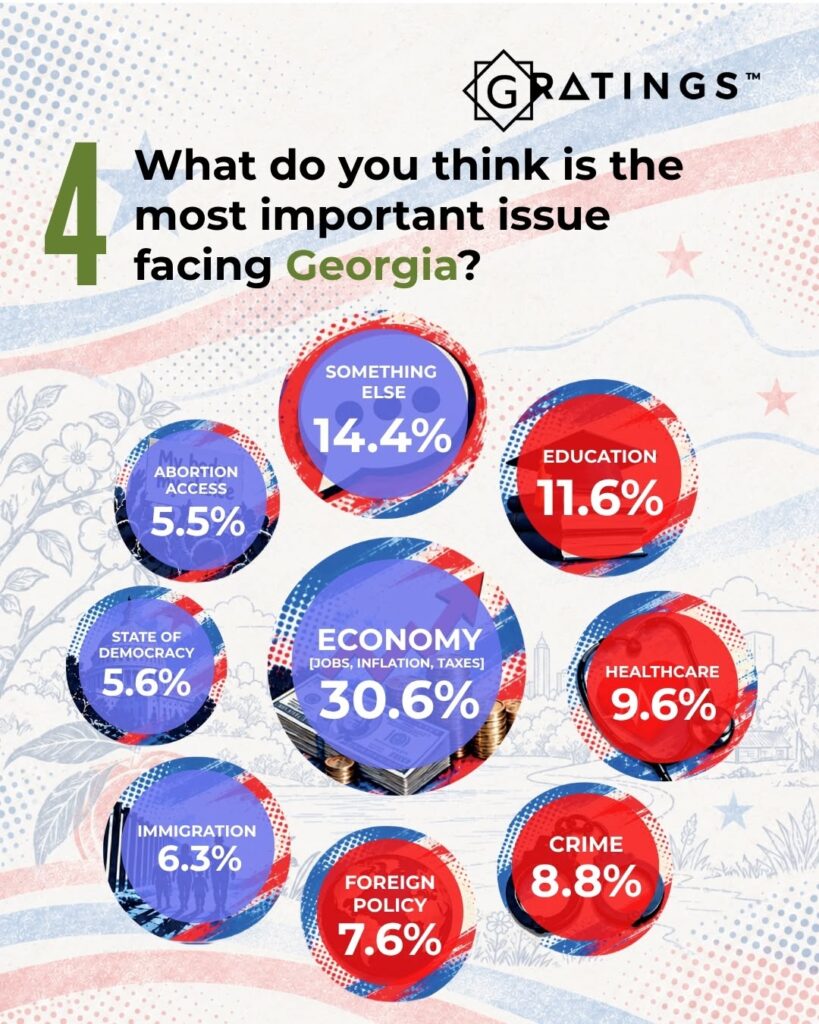
Economy ranks as the leading issue in Georgia
At G Ratings, we surveyed participants about what they considered the most important issue facing Georgia.
The economy, including jobs, inflation and taxes, received 30.6%, making it the most frequently selected issue in the study.
The complete results were:
- Economy — jobs, inflation and taxes: 30.6%
- Something else: 14.4%
- Education: 11.6%
- Healthcare: 9.6%
- Crime: 8.8%
- Foreign policy: 7.6%
- Immigration: 6.3%
- State of democracy: 5.6%
- Abortion access: 5.5%
The results show that economic concerns received the largest share of responses, followed by the Something Else category and education.
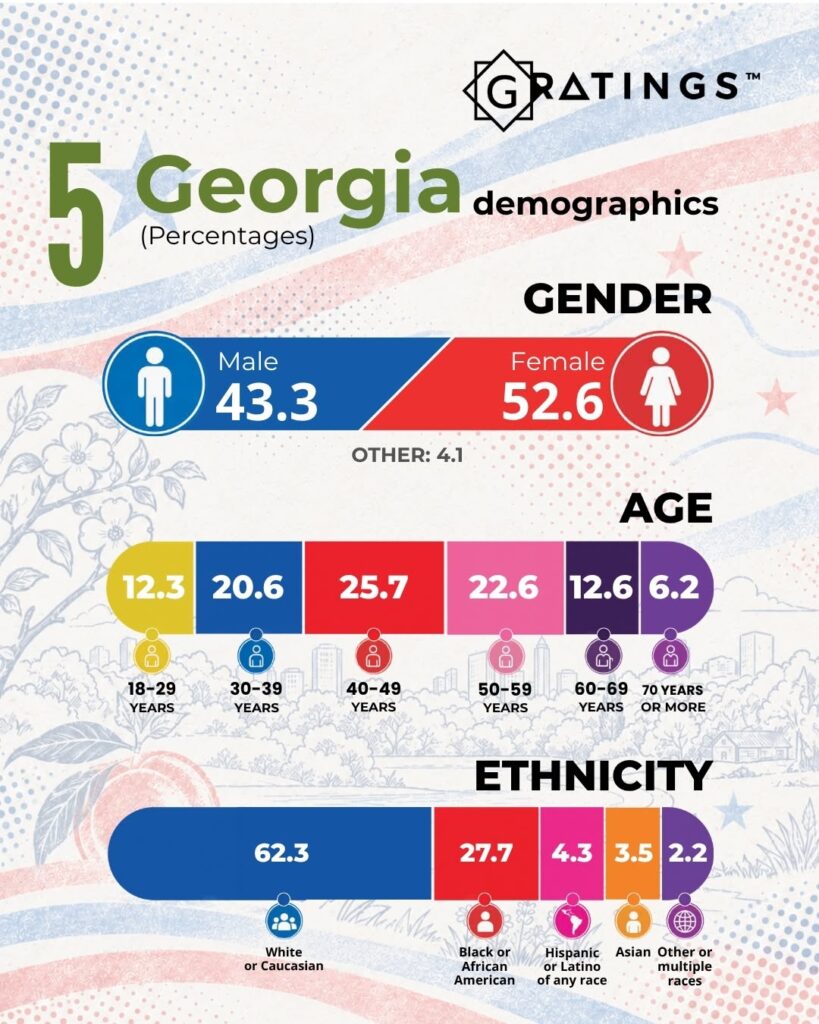
Demographic profile of the G Ratings Georgia survey
The study also presents the demographic composition of respondents included in the measurement.
By gender, the distribution was:
- Female: 52.6%
- Male: 43.3%
- Other: 4.1%
By age, respondents were distributed as follows:
- 18–29 years: 12.3%
- 30–39 years: 20.6%
- 40–49 years: 25.7%
- 50–59 years: 22.6%
- 60–69 years: 12.6%
- 70 years or older: 6.2%
By ethnicity, the distribution was:
- White or Caucasian: 62.3%
- Black or African American: 27.7%
- Hispanic or Latino of any race: 4.3%
- Asian: 3.5%
- Other or multiple races: 2.2%
G Ratings surveyed 1,000 Georgia residents
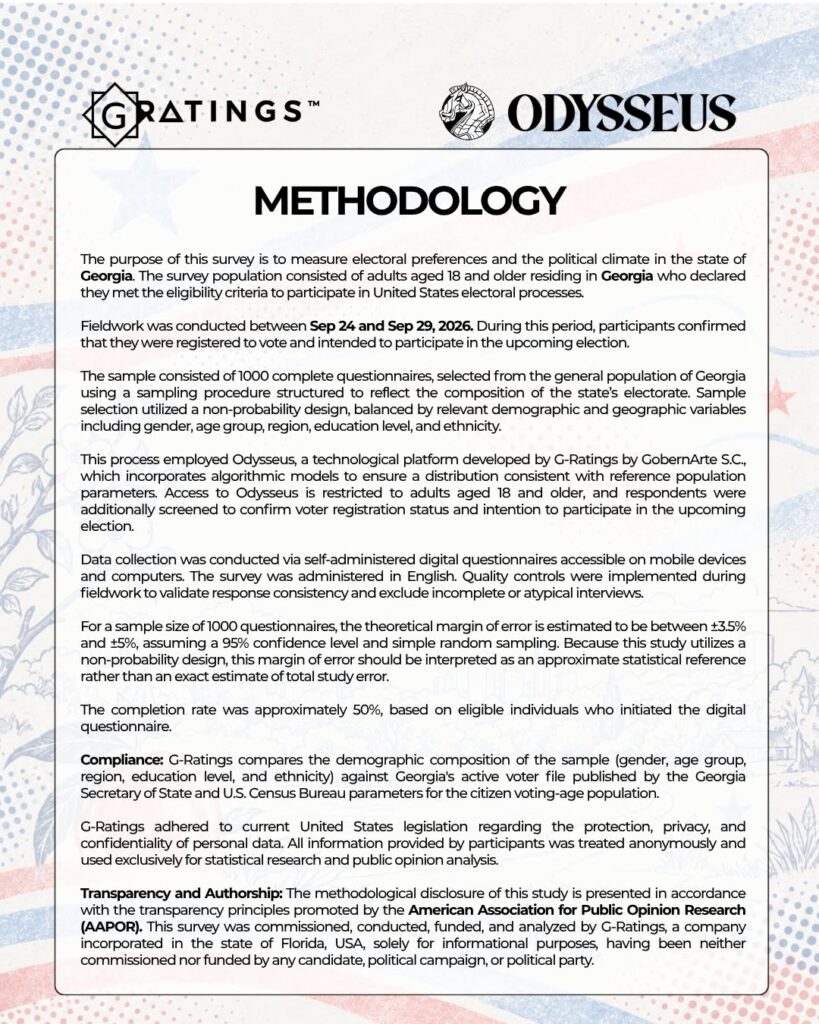
At G Ratings, we conducted fieldwork between September 24 and September 29, 2026, obtaining 1,000 completed questionnaires.
The survey population consisted of adults age 18 and older residing in Georgia who declared that they met the eligibility criteria to participate in United States electoral processes.
During the fieldwork period, participants confirmed that they were registered to vote and intended to participate in the upcoming election.
The sample used a non-probability design balanced according to relevant demographic and geographic variables, including gender, age group, region, education level and ethnicity.
Data collection was conducted through self-administered digital questionnaires accessible on mobile devices and computers. The survey was administered in English.
Odysseus supports the G Ratings research process
At G Ratings, we used Odysseus, a technological platform developed by G Ratings by GobernArte S.C., which incorporates algorithmic models designed to maintain a distribution consistent with reference population parameters.
Access to Odysseus was restricted to adults age 18 and older. Respondents were additionally screened to confirm voter registration status and their intention to participate in the upcoming election.
Quality controls were implemented during fieldwork to validate response consistency and exclude incomplete or atypical interviews.
For the sample of 1,000 completed questionnaires, the theoretical margin of error is estimated between ±3.5% and ±5%, assuming a 95% confidence level and simple random sampling.
Because the study uses a non-probability design, this margin should be interpreted as an approximate statistical reference rather than an exact estimate of total study error.
The completion rate was approximately 50%, based on eligible individuals who initiated the digital questionnaire.
At G Ratings, we present these findings as a measurement of Georgia voter opinion during the September 2026 fieldwork period. Electoral preferences and public priorities may change as the election process develops.