
Results

In G Ratings, we conducted a statewide survey to measure California’s political climate ahead of the November 2026 elections. The results show Xavier Becerra with a substantial lead in the gubernatorial race, while the contest in California’s 22nd Congressional District remains considerably tighter.
We surveyed 825 registered California voters between July 30 and August 3, 2026. Participants also confirmed their intention to vote in the upcoming election.
The findings reveal a state electorate focused primarily on economic concerns, including jobs, inflation, taxes, and manufacturing.
Becerra holds a commanding lead in the governor’s race
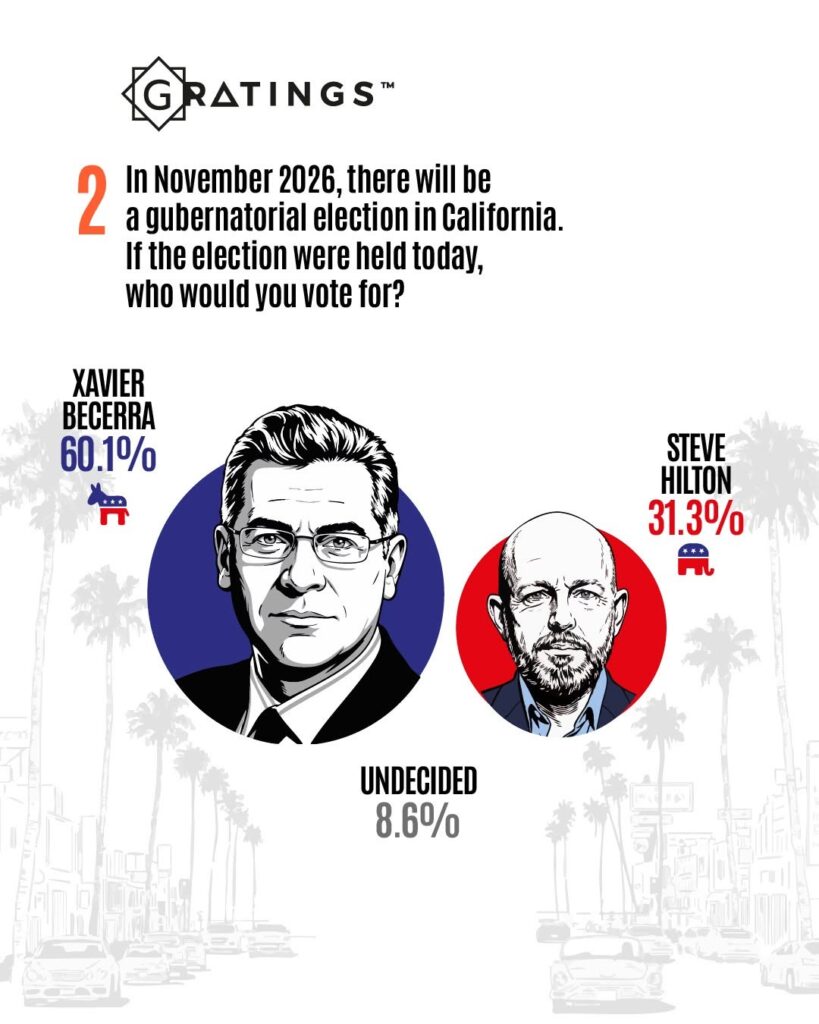
When respondents were asked whom they would support if the California gubernatorial election were held today, Xavier Becerra received 60.1% of voter preference.
The results were:
- Xavier Becerra, Democratic Party: 60.1%
- Steve Hilton, Republican Party: 31.3%
- Undecided: 8.6%
Becerra leads Hilton by 28.8 percentage points, giving the Democratic candidate a clear advantage at this stage of the race.
Although Becerra holds a decisive lead, the 8.6% of voters who remain undecided could still influence campaign strategies as candidates seek to consolidate support before Election Day.
California’s 22nd Congressional District shows a close contest
In G Ratings, we also surveyed voter preferences regarding the November 2026 election in California’s 22nd Congressional District.
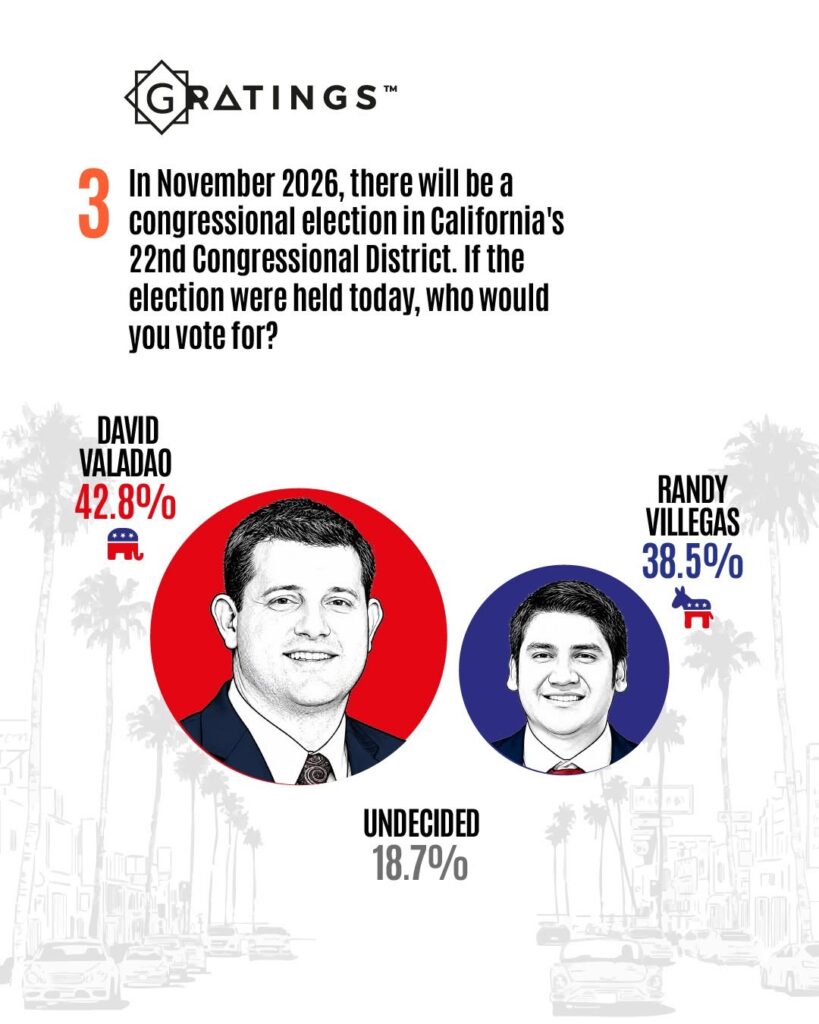
The results show Republican David Valadao with a narrow advantage over Democrat Randy Villegas:
- David Valadao, Republican Party: 42.8%
- Randy Villegas, Democratic Party: 38.5%
- Undecided: 18.7%
Valadao leads Villegas by 4.3 percentage points, but the race remains open because nearly one in five respondents have not selected a candidate.
The 18.7% undecided vote is more than four times the current difference between the two candidates. This creates a competitive environment in which voter outreach, campaign messaging, and turnout efforts could become decisive.
The economy is California voters’ top concern
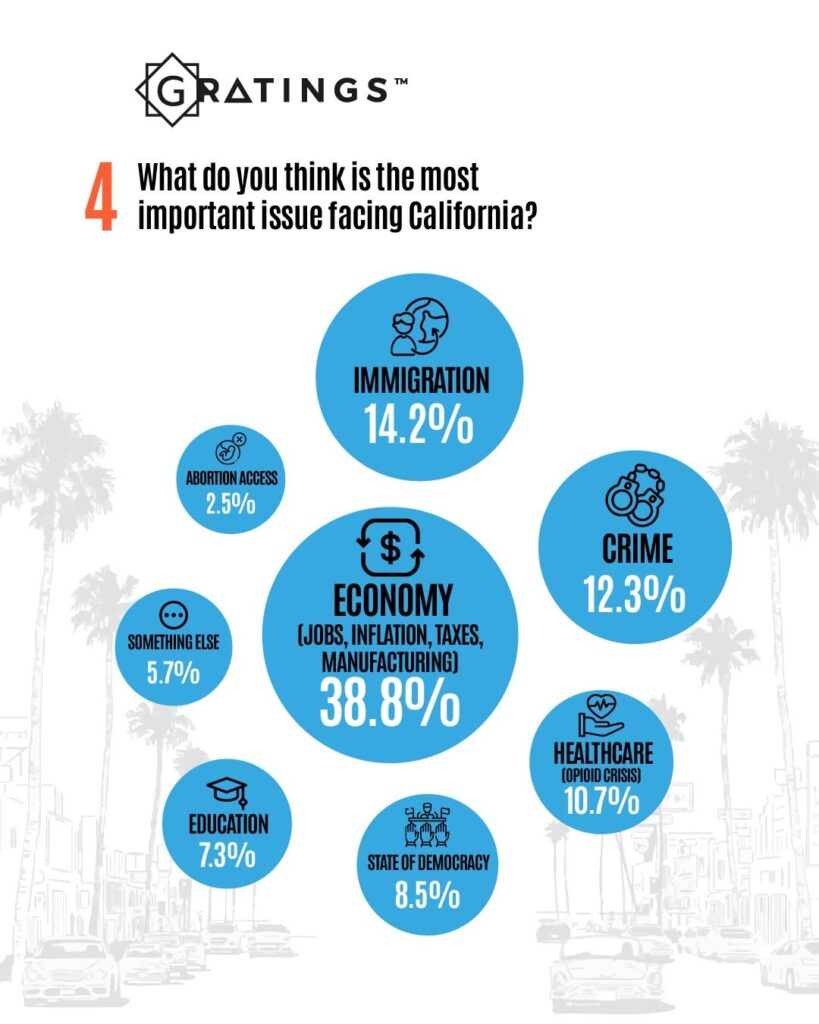
In G Ratings, we presented respondents with a list of major issues and asked them to identify the most important challenge facing California.
The economy ranked first by a significant margin:
- Economy, including jobs, inflation, taxes, and manufacturing: 38.8%
- Immigration: 14.2%
- Crime: 12.3%
- Healthcare and the opioid crisis: 10.7%
- State of democracy: 8.5%
- Education: 7.3%
- Something else: 5.7%
- Abortion access: 2.5%
Economic concerns received more support than immigration, crime, and healthcare individually. The findings indicate that financial pressure and economic stability are central to the decisions California voters may make in the 2026 elections.
Candidates seeking statewide support will likely need to address the cost of living, employment opportunities, taxation, inflation, and the future of manufacturing in California.
Democratic affiliation remains dominant in the sample
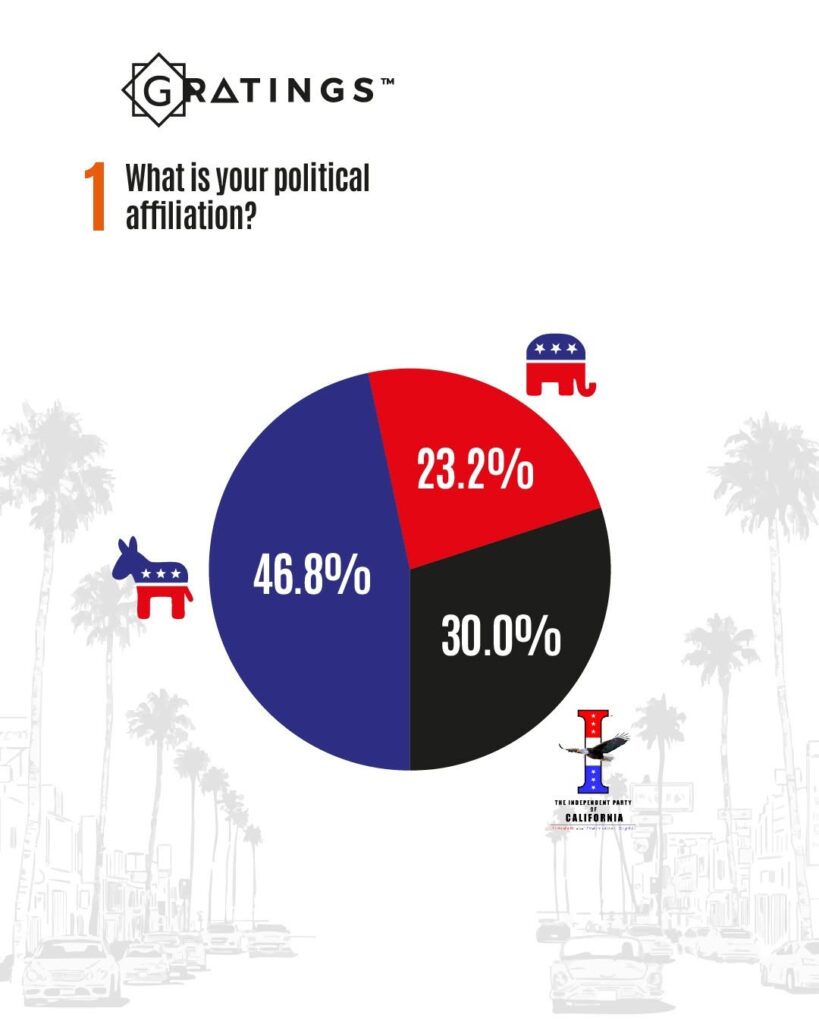
When participants were asked about their political affiliation, the distribution was:
- Democratic Party: 46.8%
- Independent Party: 30.0%
- Republican Party: 23.2%
Democrats represent the largest political group in the sample. However, independent voters account for nearly one-third of respondents, making them an important segment in both statewide and congressional campaigns.
Demographic profile of respondents
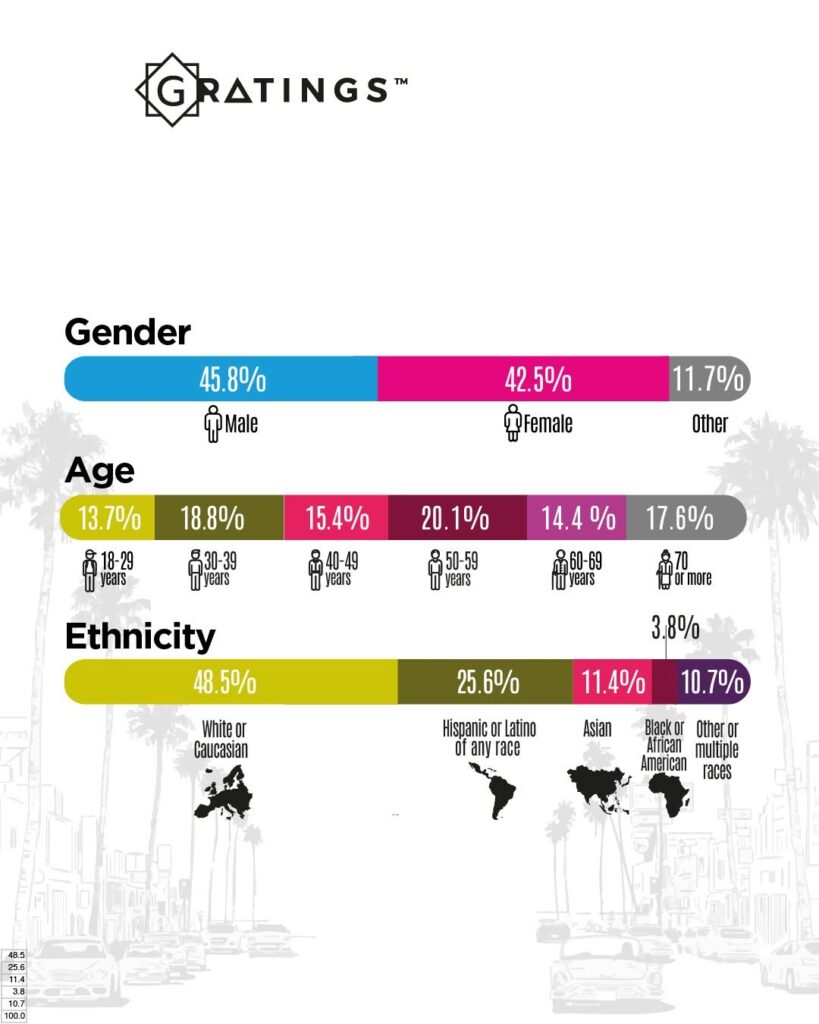
The survey included California voters from different gender, age, and ethnic groups.
The gender distribution was:
- Male: 45.8%
- Female: 42.5%
- Other: 11.7%
The age distribution was:
- 18 to 29 years: 13.7%
- 30 to 39 years: 18.8%
- 40 to 49 years: 15.4%
- 50 to 59 years: 20.1%
- 60 to 69 years: 14.4%
- 70 years or older: 17.6%
The ethnic distribution was:
- White or Caucasian: 48.5%
- Hispanic or Latino of any race: 25.6%
- Asian: 11.4%
- Black or African American: 3.8%
- Other or multiple races: 10.7%
Survey methodology
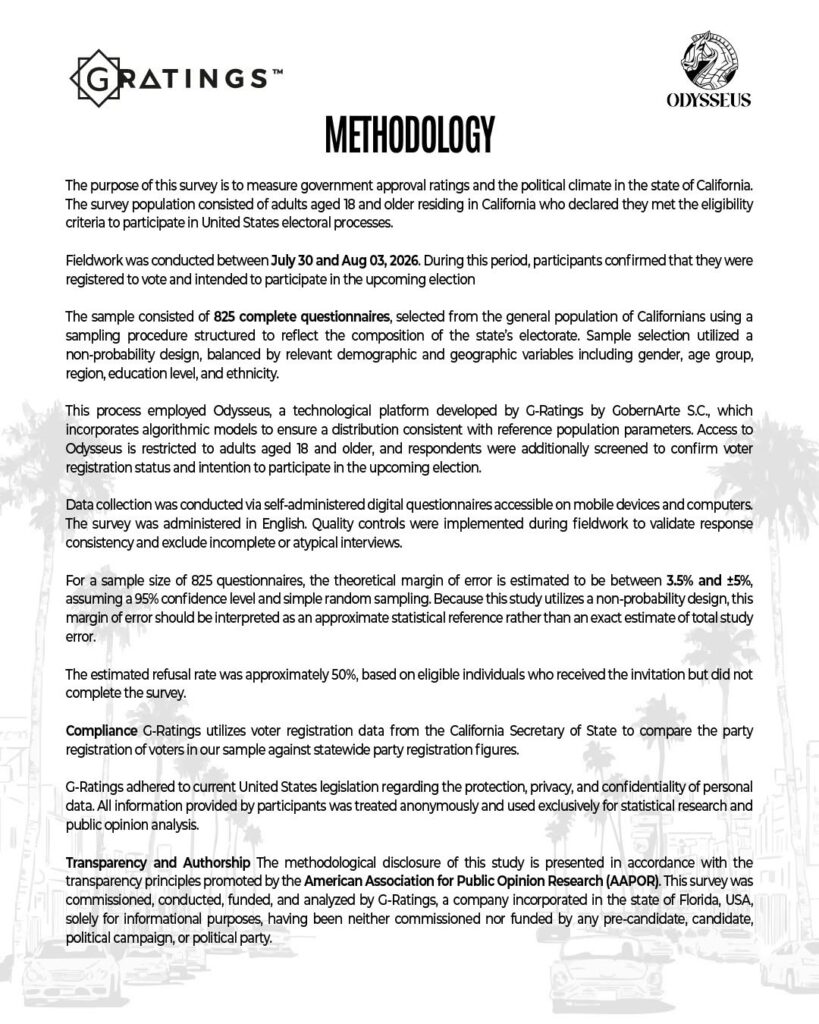
In G Ratings, we conducted the fieldwork from July 30 through August 3, 2026, using self-administered digital questionnaires available on mobile devices and computers.
The sample consisted of 825 completed questionnaires from California residents aged 18 or older who confirmed they were registered to vote and intended to participate in the upcoming election.
The study used a non-probability sampling design balanced by demographic and geographic variables, including gender, age, region, education level, and ethnicity.
Data collection was supported by Odysseus, a technological platform developed by G Ratings by GobernArte S.C. The platform incorporates algorithmic models and Artificial intelligence tools to produce a sample distribution consistent with reference population parameters.
Quality controls were applied to verify response consistency and exclude incomplete or atypical questionnaires.
For a sample of 825 completed questionnaires, the theoretical margin of error is estimated between ±3.5% and ±5%, assuming a 95% confidence level and simple random sampling. Because the survey used a non-probability design, this range should be interpreted as an approximate statistical reference.
The estimated refusal rate was approximately 50%. G Ratings also used voter registration data from the California Secretary of State to compare the partisan composition of the sample with statewide registration figures.
In G Ratings, we present these results exclusively for informational and public opinion research purposes. The survey was commissioned, conducted, funded, and analyzed by G Ratings and was not commissioned or financed by any potential candidate, candidate, political campaign, or political party.