
Results


In G Ratings, we conducted a statewide survey to measure electoral preferences and the political climate in Ohio ahead of the November 2026 elections.
The results show two highly competitive races. Amy Acton holds a narrow advantage over Vivek Ramaswamy in the contest for governor, while Sherrod Brown leads Jon Husted in the special election for Ohio’s U.S. Senate seat.
We surveyed 900 registered Ohio voters between August 5 and August 10, 2026. Participants confirmed that they intended to vote in the upcoming election.
Amy Acton leads the Ohio governor’s race by 2.6 points
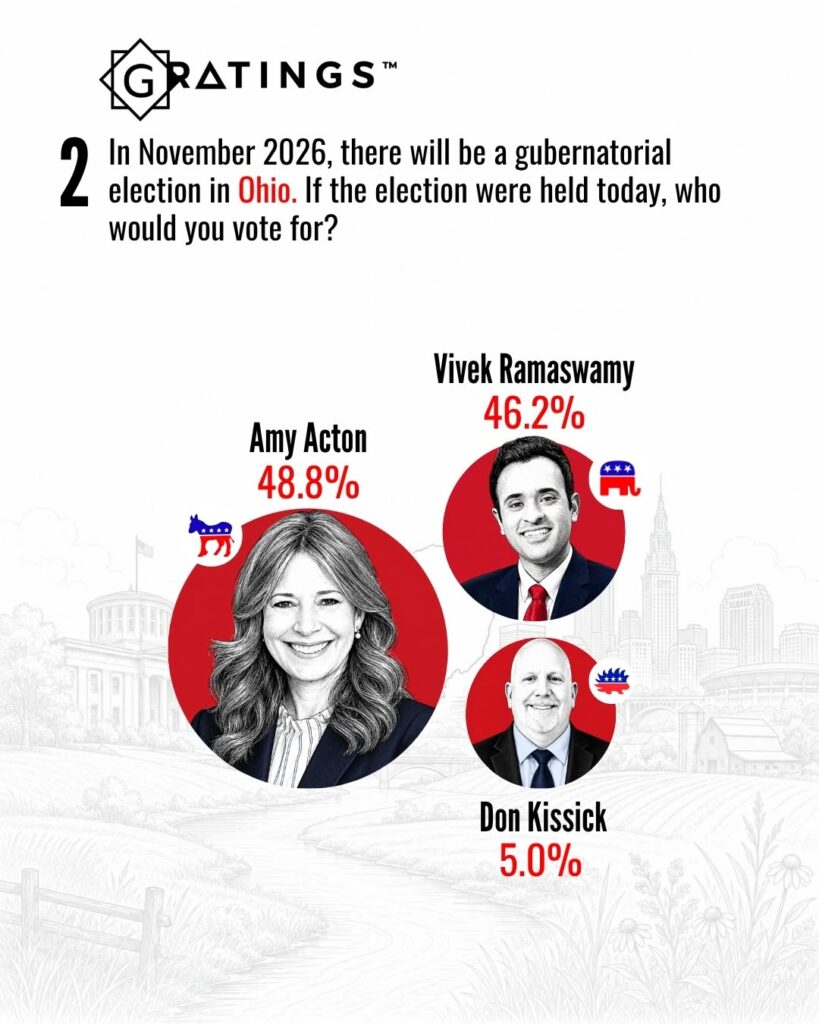
When respondents were asked whom they would support if the gubernatorial election were held today, Amy Acton received 48.8%, placing her slightly ahead of Vivek Ramaswamy.
The results were:
- Amy Acton: 48.8%
- Vivek Ramaswamy: 46.2%
- Don Kissick: 5.0%
Acton leads Ramaswamy by 2.6 percentage points, indicating a closely divided electorate and a race that remains competitive heading into the final months of the campaign.
The combined support for Acton and Ramaswamy reaches 95%, suggesting that most respondents have already aligned with one of the two leading candidates.
Sherrod Brown leads Ohio’s special U.S. Senate election
In G Ratings, we also surveyed Ohio voters about the 2026 special election for the state’s U.S. Senate seat.
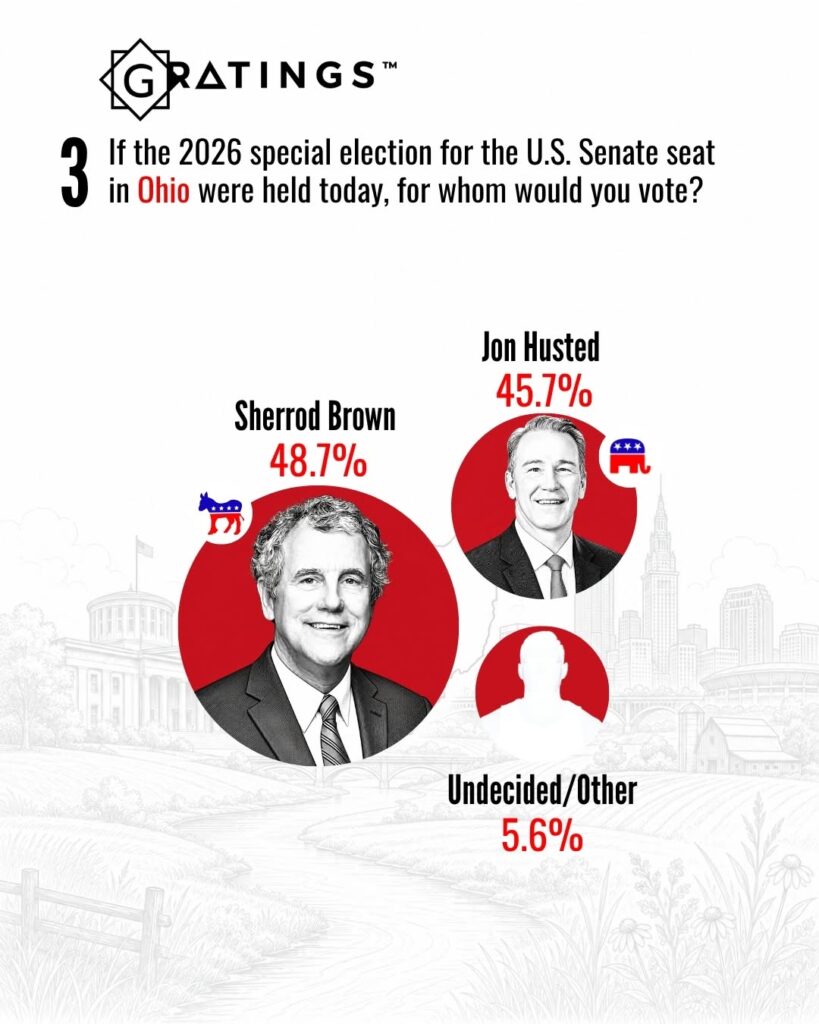
The results place Sherrod Brown ahead of Jon Husted:
- Sherrod Brown: 48.7%
- Jon Husted: 45.7%
- Undecided or another candidate: 5.6%
Brown holds a three-point advantage over Husted. However, the difference remains narrow enough for the undecided vote and campaign turnout to influence the final result.
Only 5.6% of respondents remain undecided or prefer another candidate, making the contest highly dependent on each campaign’s ability to mobilize its existing supporters.
Ohio voters express concerns beyond the listed issues
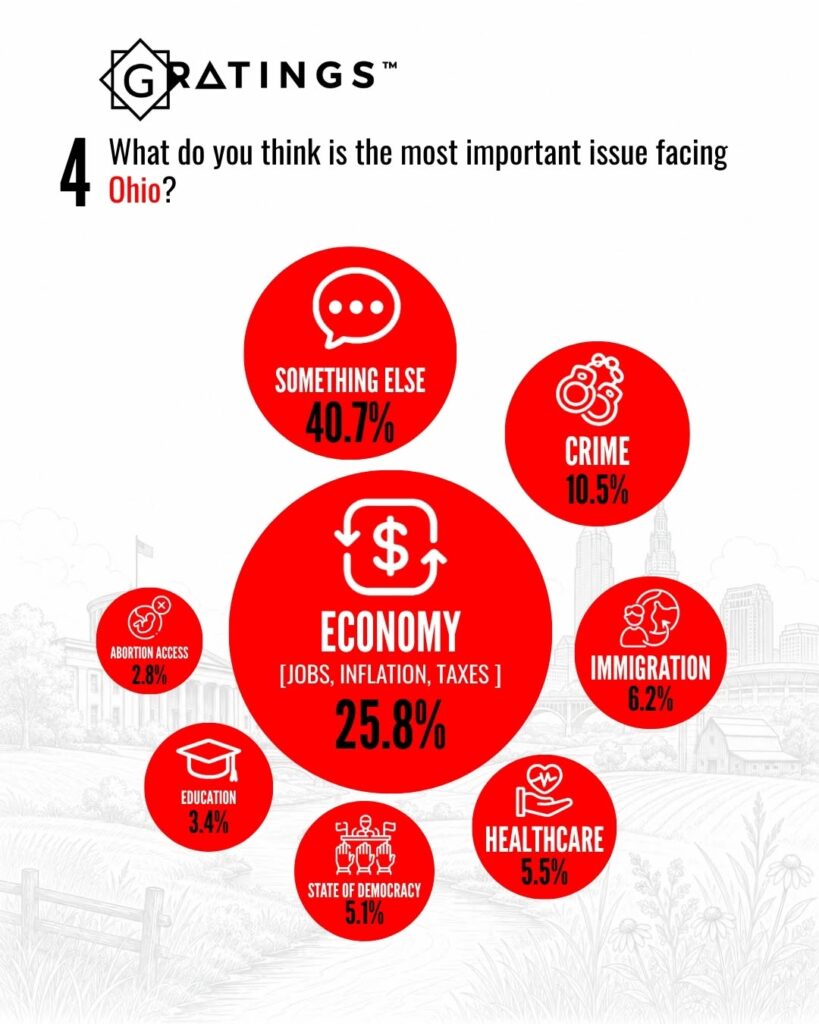
When respondents were asked to identify the most important issue facing Ohio, 40.7% selected “something else.” This result suggests that many voters are concerned about issues not included among the principal response options.
The complete results were:
- Something else: 40.7%
- Economy, including jobs, inflation, and taxes: 25.8%
- Crime: 10.5%
- Immigration: 6.2%
- Healthcare: 5.5%
- State of democracy: 5.1%
- Education: 3.4%
- Abortion access: 2.8%
Among the specific issues presented, the economy ranked first with 25.8%. Economic concerns received more than twice the support registered for crime, the second-highest specific issue.
The findings indicate that jobs, inflation, and taxes could play an important role in the decisions Ohio voters make in both the gubernatorial and U.S. Senate elections.
Republicans represent the largest political group in the sample
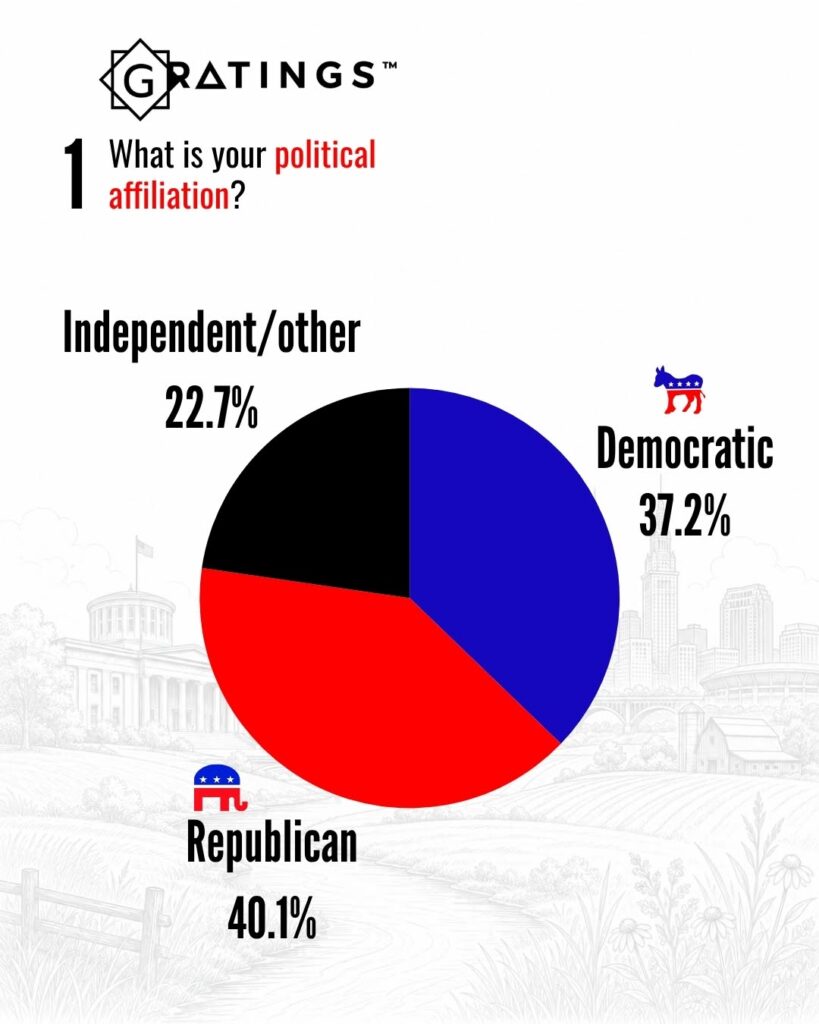
In G Ratings, we asked participants to identify their political affiliation. Republicans accounted for the largest share of respondents, followed closely by Democrats.
The distribution was:
- Republican: 40.1%
- Democratic: 37.2%
- Independent or other: 22.7%
Republicans outnumber Democrats by 2.9 percentage points in the sample. Independent and other voters represent more than one-fifth of respondents and could become an influential group in both major races.
Ohio does not record political party affiliation during voter registration. Therefore, these percentages reflect how respondents identified themselves and were not used as a weighting target for the survey.
Demographic profile of respondents
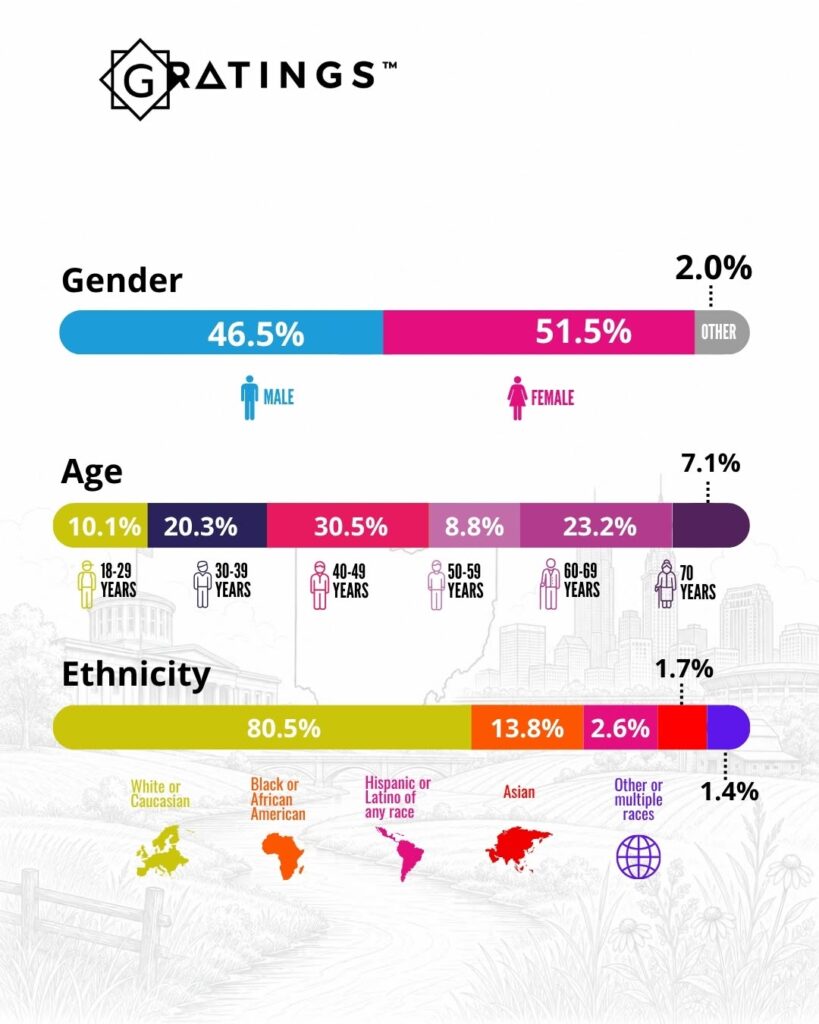
The survey included Ohio voters from different gender, age, and ethnic groups.
The gender distribution was:
- Female: 51.5%
- Male: 46.5%
- Other: 2.0%
The age distribution was:
- 18 to 29 years: 10.1%
- 30 to 39 years: 20.3%
- 40 to 49 years: 30.5%
- 50 to 59 years: 8.8%
- 60 to 69 years: 23.2%
- 70 years or older: 7.1%
The ethnic distribution was:
- White or Caucasian: 80.5%
- Black or African American: 13.8%
- Hispanic or Latino of any race: 2.6%
- Asian: 1.7%
- Other or multiple races: 1.4%
Survey methodology
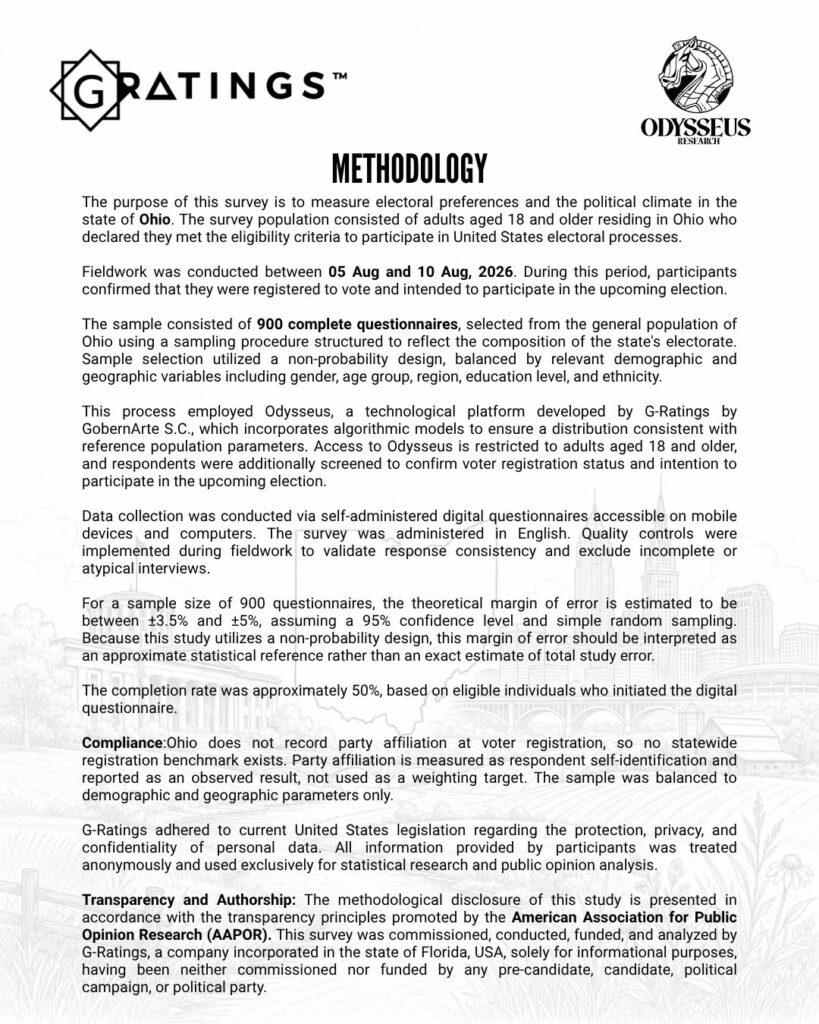
In G Ratings, we conducted the fieldwork from August 5 through August 10, 2026, using self-administered digital questionnaires accessible on mobile devices and computers.
We surveyed 900 Ohio residents aged 18 or older who confirmed that they were registered to vote and intended to participate in the upcoming election.
The study used a non-probability sampling design balanced by relevant demographic and geographic variables, including gender, age group, region, education level, and ethnicity.
Data collection was supported by Odysseus, a technological platform developed by G Ratings by GobernArte S.C. The platform incorporates algorithmic models and Artificial intelligence tools to maintain a distribution consistent with reference population parameters.
Quality controls were implemented during fieldwork to validate the consistency of responses and exclude incomplete or atypical questionnaires.
For a sample of 900 completed questionnaires, the theoretical margin of error is estimated between ±3.5% and ±5%, assuming a 95% confidence level and simple random sampling. Because the survey used a non-probability design, this range should be interpreted as an approximate statistical reference rather than an exact estimate of total study error.
The questionnaire completion rate was approximately 50% among eligible individuals who began the digital survey.
In G Ratings, we present these findings exclusively for informational and public opinion research purposes. The survey was commissioned, conducted, funded, and analyzed by G Ratings. It was not commissioned or funded by any potential candidate, candidate, political campaign, or political party.