
Results


At G Ratings, we conducted a statewide survey to measure voter preferences and the political climate ahead of the 2026 general election in California. The results show Democratic candidate Xavier Becerra leading the race for governor with 50.3% of voter preference.
We surveyed 825 registered voters in California who indicated that they intended to participate in the upcoming election. Fieldwork was conducted between August 30 and September 3, 2026.
At G Ratings, we present a gubernatorial contest in which Becerra currently holds a double-digit advantage over Republican candidate Steve Hilton, while 12.1% of respondents remain undecided.
California 2026 governor election: Becerra leads Hilton
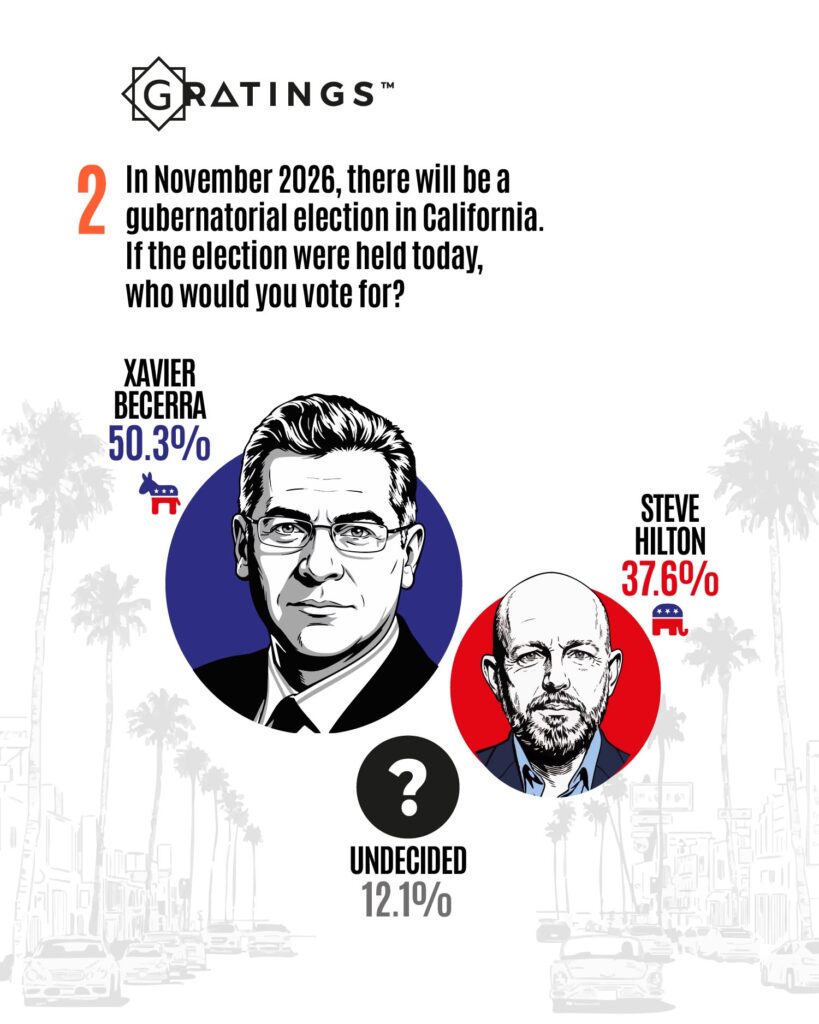
At G Ratings, we present the results of the question: In November 2026, there will be a gubernatorial election in California. If the election were held today, who would you vote for?
- Xavier Becerra: 50.3%
- Steve Hilton: 37.6%
- Undecided: 12.1%
The results place Xavier Becerra 12.7 percentage points ahead of Steve Hilton in the current measurement.
Becerra surpasses the 50% threshold, while Hilton receives support from more than one-third of respondents. At the same time, 12.1% of voters remain undecided, representing a significant segment of the electorate as the November election approaches.
The findings provide a snapshot of voter preference during the survey period and show an advantage for the Democratic candidate at this stage of the campaign.
California’s 22nd Congressional District remains competitive
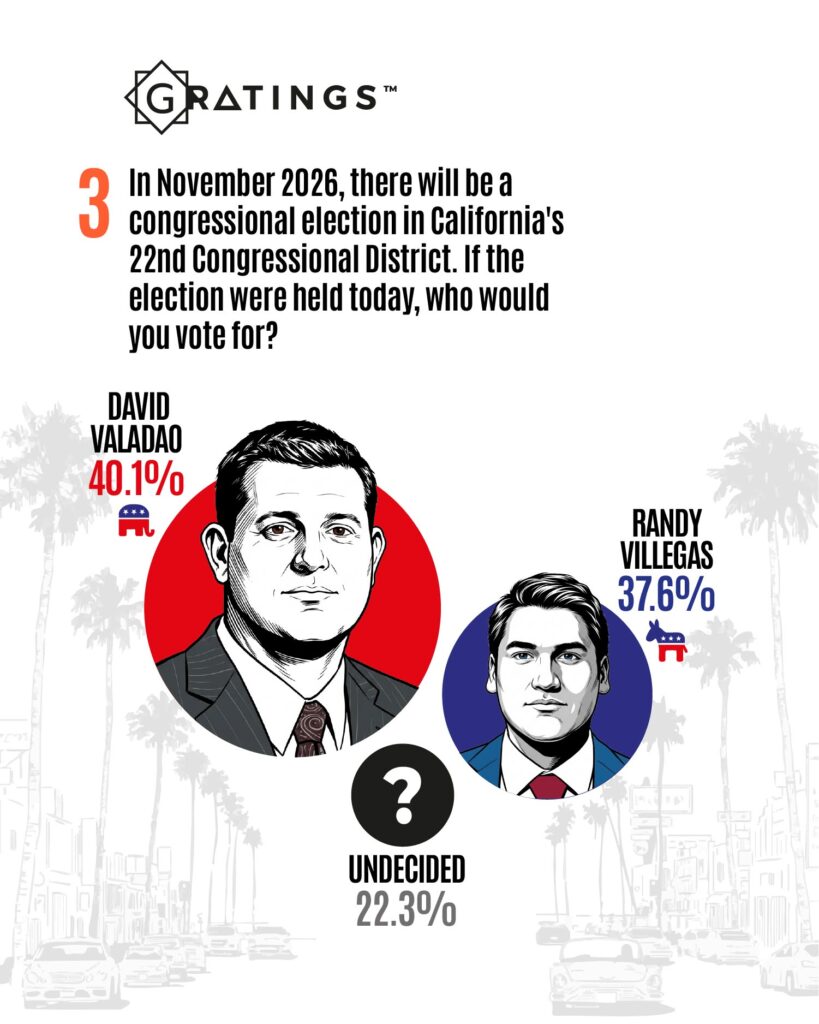
At G Ratings, we also surveyed voters about the 2026 congressional election in California’s 22nd Congressional District.
The results show Republican David Valadao at 40.1%, followed closely by Democrat Randy Villegas at 37.6%.
- David Valadao: 40.1%
- Randy Villegas: 37.6%
- Undecided: 22.3%
Valadao leads Villegas by 2.5 percentage points, making this congressional contest substantially closer than the statewide race for governor.
The most notable factor is the 22.3% of respondents who remain undecided. More than one in five voters surveyed had not selected either candidate at the time of the study.
This undecided segment could become particularly relevant as the campaign progresses and voters receive more information about the candidates and their proposals.
Democrats represent the largest political affiliation group
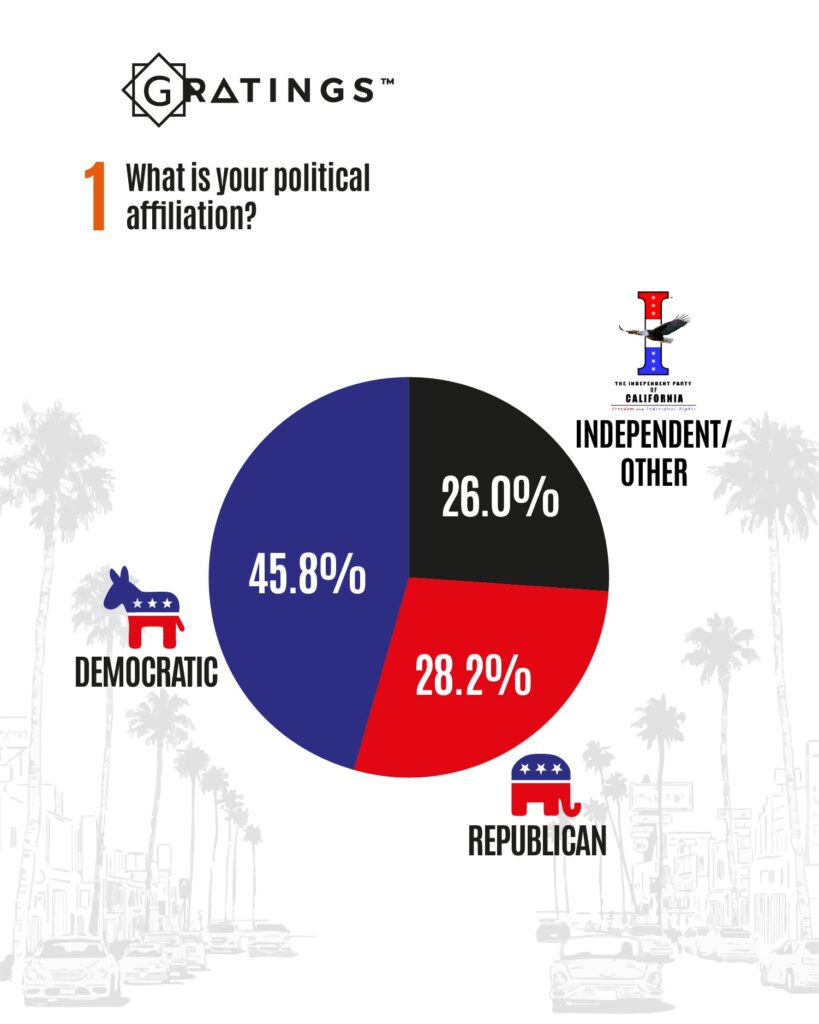
At G Ratings, we also surveyed respondents about their political affiliation to provide additional context for the electoral preferences recorded in the study.
- Democratic: 45.8%
- Republican: 28.2%
- Independent/Other: 26.0%
Democrats represent the largest group among respondents, accounting for nearly half of the sample.
Republicans represent 28.2%, while independent and other voters account for 26.0%.
The presence of more than one-quarter of respondents outside the two major-party identification groups highlights the importance of independent and other voters in California’s political landscape.
Economy is the top issue facing California
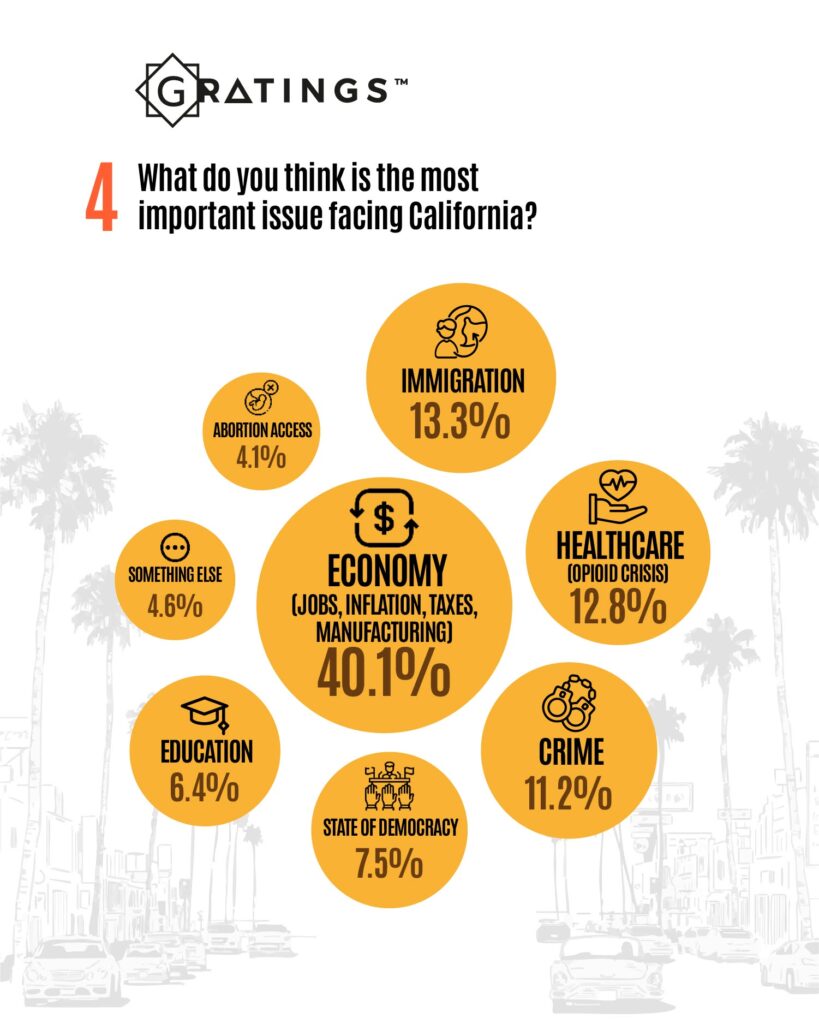
Beyond candidate preference, at G Ratings we surveyed voters about what they consider the most important issue currently facing California.
The economy ranks first with 40.1%, making it the leading concern by a significant margin. The category includes jobs, inflation, taxes and manufacturing.
- Economy — jobs, inflation, taxes and manufacturing: 40.1%
- Immigration: 13.3%
- Healthcare, including the opioid crisis: 12.8%
- Crime: 11.2%
- State of democracy: 7.5%
- Education: 6.4%
- Something else: 4.6%
- Abortion access: 4.1%
Economic concerns exceed the second-ranked issue, immigration, by 26.8 percentage points.
The results indicate that questions involving employment, inflation, taxation and manufacturing are currently central to the concerns of California voters surveyed by G Ratings.
Immigration, healthcare and crime follow economic concerns
Although the economy dominates the survey, several other issues register significant levels of concern.
Immigration ranks second at 13.3%, followed closely by healthcare, including the opioid crisis, at 12.8%.
Crime is identified by 11.2% of respondents, while 7.5% name the state of democracy as their most important issue.
Education, other concerns and abortion access register smaller shares of responses.
The distribution illustrates an electorate primarily focused on economic conditions while also paying attention to immigration, healthcare, public safety and democratic institutions.
California voters face different dynamics in statewide and congressional races
At G Ratings, we present two electoral contests with notably different characteristics.
In the governor’s race, Xavier Becerra leads Steve Hilton by 12.7 percentage points and reaches 50.3% support.
In California’s 22nd Congressional District, David Valadao’s advantage over Randy Villegas is only 2.5 points.
The percentage of undecided voters also differs significantly between the two races. While 12.1% remain undecided in the gubernatorial contest, that figure rises to 22.3% in the congressional race.
These differences show why electoral preferences must be analyzed individually across races rather than assuming that statewide political trends will be replicated uniformly at the congressional level.
Profile of the California electorate surveyed
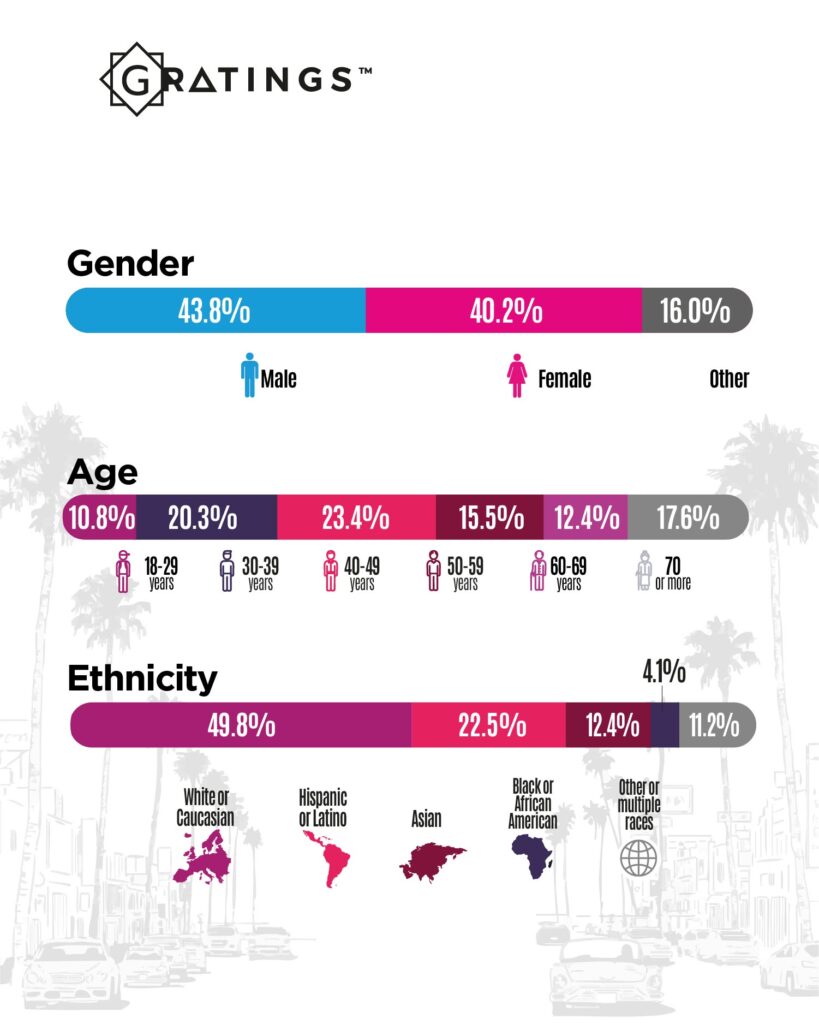
At G Ratings, we surveyed voters from different demographic groups as part of the study.
By gender:
- Male: 43.8%
- Female: 40.2%
- Other: 16.0%
By age:
- Ages 18–29: 10.8%
- Ages 30–39: 20.3%
- Ages 40–49: 23.4%
- Ages 50–59: 15.5%
- Ages 60–69: 12.4%
- Ages 70 or older: 17.6%
The largest age group in the survey was respondents between 40 and 49 years old, representing 23.4% of the sample.
Survey methodology
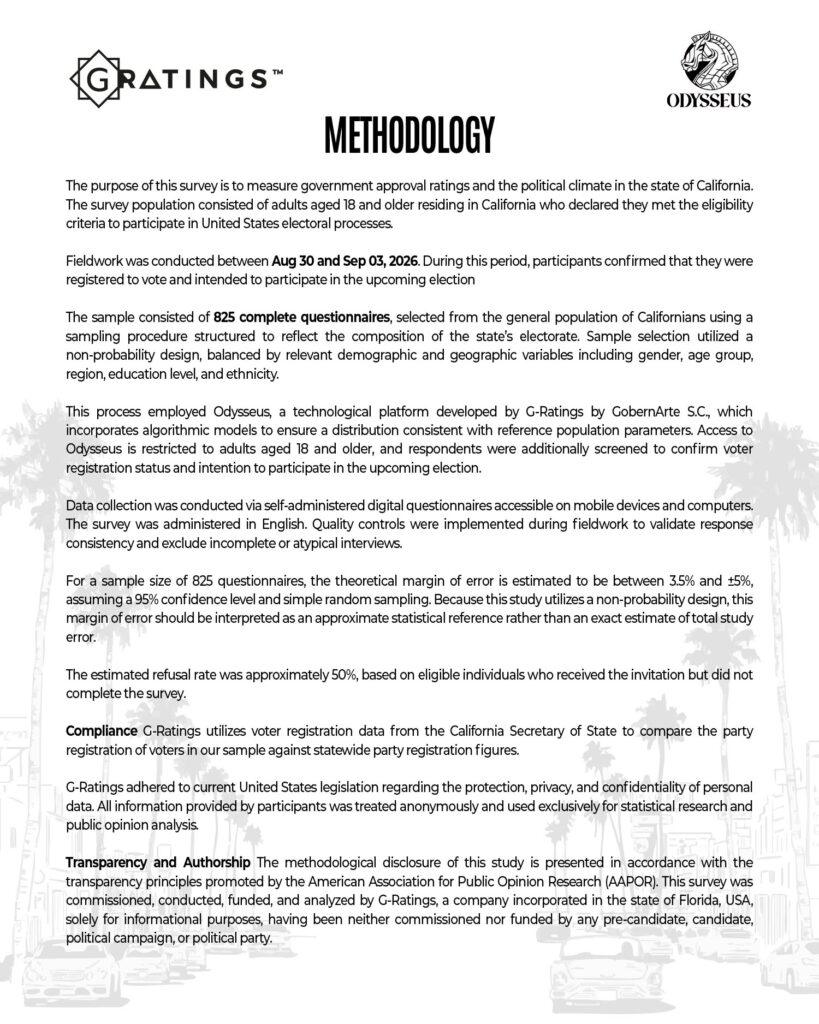
At G Ratings, we surveyed 825 adults aged 18 and older residing in California who indicated that they met the eligibility criteria to participate in United States electoral processes.
Fieldwork was conducted between August 30 and September 3, 2026. Participants confirmed that they were registered to vote and intended to participate in the upcoming election.
The sample used a non-probability design structured to reflect relevant demographic and geographic characteristics of California’s electorate, including gender, age group, region, education level and ethnicity.
Data collection was conducted through self-administered digital questionnaires accessible on mobile devices and computers. The survey was administered in English.
The study used Odysseus, a technological platform developed by G-Ratings by GobernArte S.C., incorporating algorithmic models designed to support sample distribution according to population reference parameters.
For the sample of 825 completed questionnaires, the theoretical margin of error was estimated between ±3.5% and ±5%, assuming a 95% confidence level and simple random sampling.
Because the study uses a non-probability design, this margin of error should be interpreted as an approximate statistical reference rather than an exact estimate of total survey error.
The estimated refusal rate was approximately 50%, based on eligible individuals who received the invitation but did not complete the survey.
G Ratings used voter registration information from the California Secretary of State to compare the party registration composition of respondents with statewide registration figures.
The survey was commissioned, conducted, funded and analyzed by G Ratings exclusively for informational purposes and was not commissioned or funded by any pre-candidate, candidate, political campaign or political party.