
Results


At G Ratings, we conducted a statewide public opinion survey to measure electoral preferences and the political climate ahead of the 2026 Illinois Governor General Election.
We surveyed adults aged 18 and older residing in Illinois who confirmed that they were registered to vote and intended to participate in the upcoming election.
In this study, we present the latest findings on voter preference, political affiliation, the main issues facing Illinois, and the demographic profile of respondents.
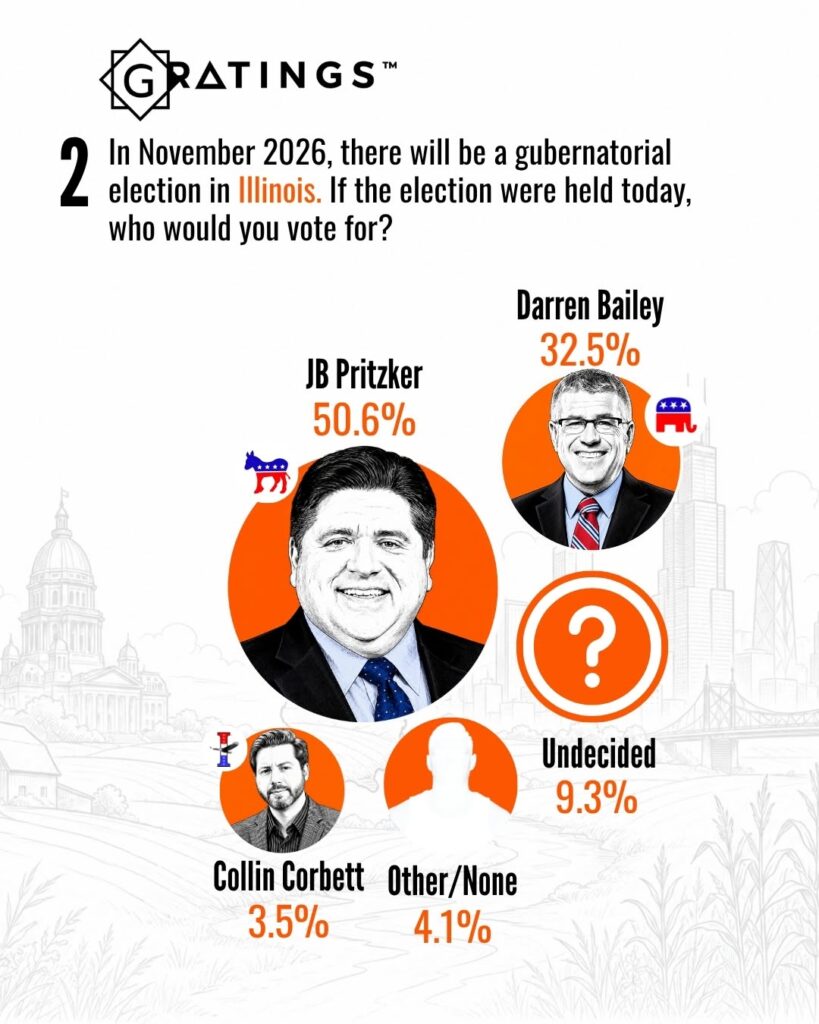
The results show JB Pritzker leading the gubernatorial race with 50.6%, followed by Darren Bailey with 32.5%.
General Election Preference for Governor
If the 2026 gubernatorial election in Illinois were held today, respondents expressed the following voting preferences:
- JB Pritzker: 50.6%
- Darren Bailey: 32.5%
- Undecided: 9.3%
- Other or None: 4.1%
- Collin Corbett: 3.5%
The results indicate that JB Pritzker holds an 18.1-point advantage over Darren Bailey and surpasses the 50% threshold among respondents.
The undecided share remains relevant, while support for alternative options represents a smaller segment of the electorate as the campaign moves toward the 2026 election.
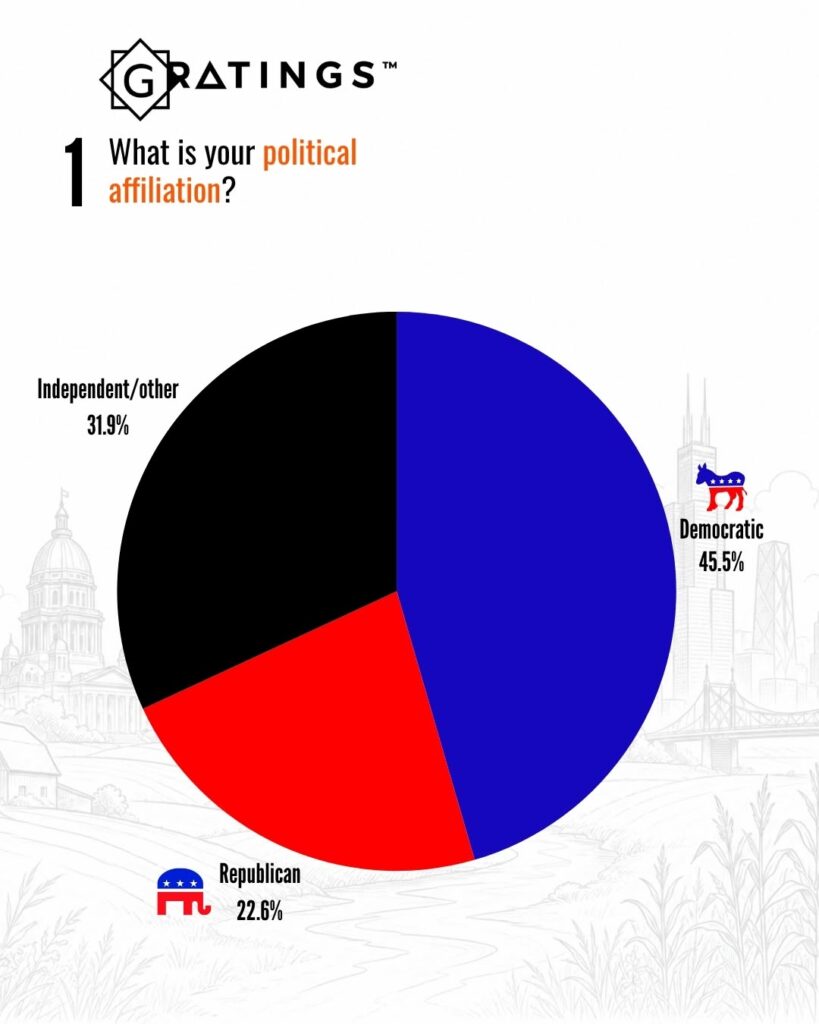
Political Affiliation of Respondents
At G Ratings, we also measured the political affiliation of survey participants. The results show a Democratic-leaning electorate with a substantial independent or other segment.
- Democratic affiliation: 45.5%
- Independent or other affiliation: 31.9%
- Republican affiliation: 22.6%
This distribution provides context for the current voter preference results and highlights the potential influence of independent and unaffiliated voters in the statewide contest.
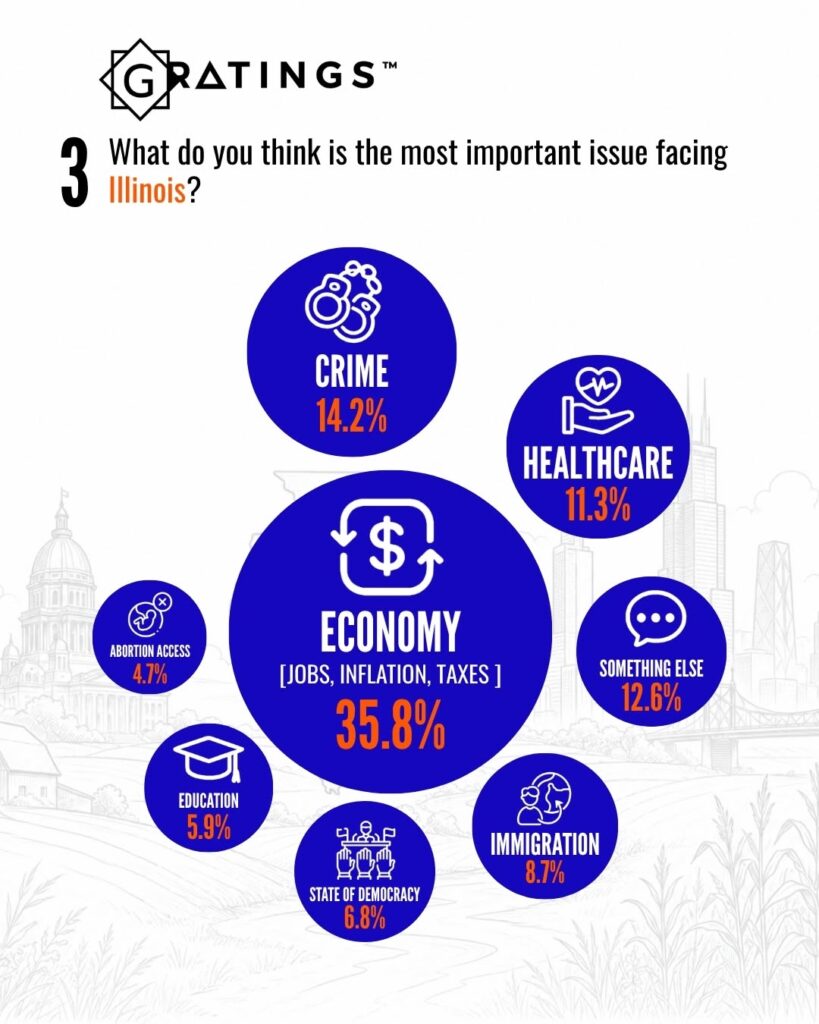
Main Issues Facing Illinois
We surveyed respondents about what they consider the most important issue facing Illinois today. The results show that the economy is the leading concern by a wide margin.
- Economy, jobs, inflation, and taxes: 35.8%
- Crime: 14.2%
- Something else: 12.6%
- Healthcare: 11.3%
- Immigration: 8.7%
- State of democracy: 6.8%
- Education: 5.9%
- Abortion access: 4.7%
The findings suggest that economic conditions, employment, inflation, and taxes are shaping voter priorities as Illinois approaches the 2026 gubernatorial election.
Public safety, healthcare, immigration, and concerns not included among the listed categories also remain relevant within the state’s political conversation.
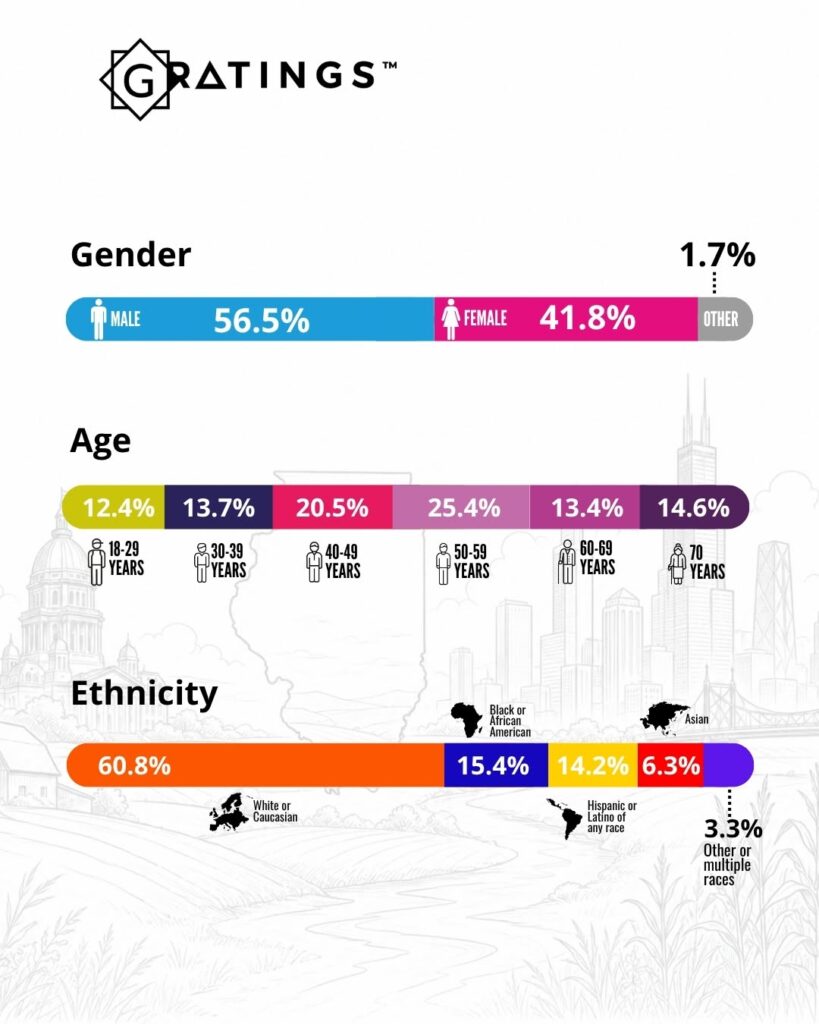
Demographic Profile of the Survey
The survey included a demographic profile across gender, age, and ethnicity.
By gender, respondents were distributed as follows:
- Male: 56.5%
- Female: 41.8%
- Other: 1.7%
By age group, respondents were distributed as follows:
- 18–29 years: 12.4%
- 30–39 years: 13.7%
- 40–49 years: 20.5%
- 50–59 years: 25.4%
- 60–69 years: 13.4%
- 70 years or older: 14.6%
By ethnicity, the survey recorded the following composition:
- White or Caucasian: 60.8%
- Black or African American: 15.4%
- Hispanic or Latino of any race: 14.2%
- Asian: 6.3%
- Other or multiple races: 3.3%
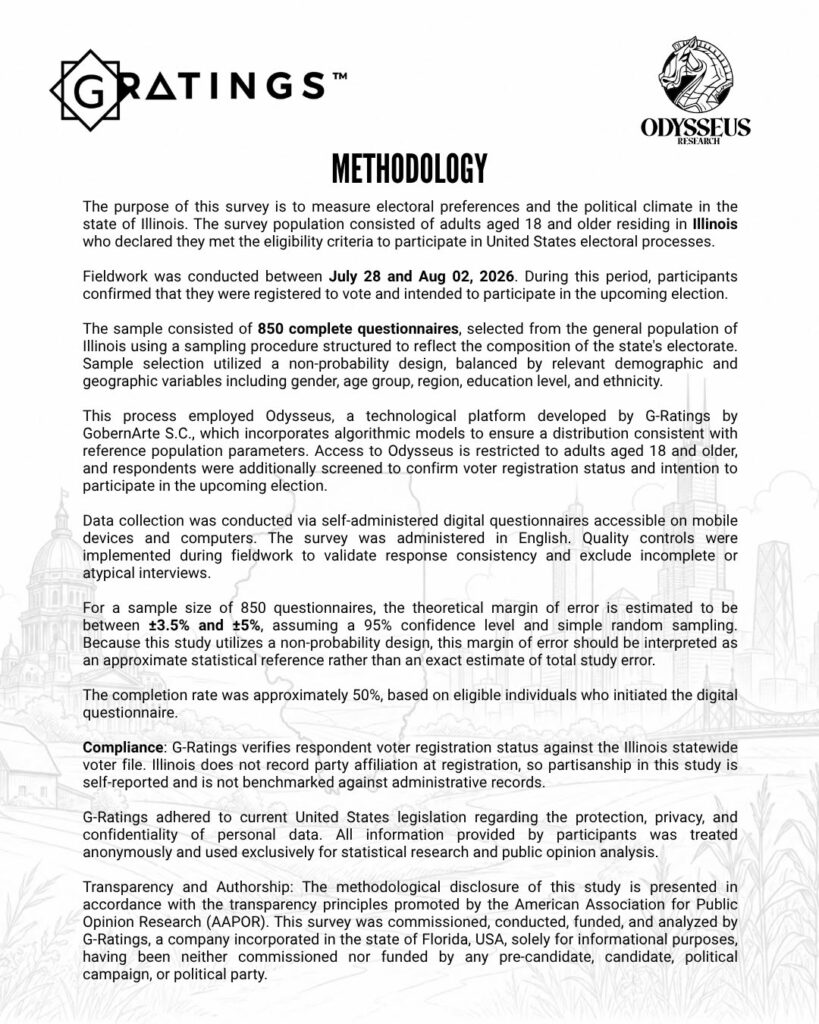
Methodology
At G Ratings, we conducted this survey among 850 complete questionnaires from adults aged 18 and older residing in Illinois.
Fieldwork was conducted between July 28 and August 2, 2026. During this period, participants confirmed that they were registered to vote and intended to participate in the upcoming election.
The study used a non-probability sample design, balanced by relevant demographic and geographic variables, including gender, age group, region, education level, and ethnicity.
This process employed Odysseus, a technological platform developed by G Ratings by GobernArte S.C., incorporating algorithmic models designed to ensure a distribution consistent with reference population parameters.
Access to Odysseus was restricted to adults aged 18 and older. Respondents were also screened to confirm their voter registration status and intention to participate in the upcoming election.
Data collection was conducted through self-administered digital questionnaires accessible on mobile devices and computers. The survey was administered in English.
Quality controls were implemented during fieldwork to validate response consistency and exclude incomplete or atypical interviews.
For a sample size of 850 questionnaires, the theoretical margin of error is estimated between ±3.5% and ±5%, assuming a 95% confidence level and simple random sampling.
Because this study uses a non-probability design, the margin of error should be interpreted as an approximate statistical reference rather than an exact estimate of total study error.
The completion rate was approximately 50%, based on eligible individuals who initiated the digital questionnaire.
G Ratings verified respondents’ voter registration status against the Illinois statewide voter file. Illinois does not record party affiliation at registration, so partisanship in this study was self-reported and was not benchmarked against administrative records.
G Ratings adhered to current United States legislation regarding the protection, privacy, and confidentiality of personal data. All information provided by participants was treated anonymously and used exclusively for statistical research and public opinion analysis.
The methodological disclosure was prepared in accordance with the transparency principles promoted by the American Association for Public Opinion Research.
This survey was commissioned, conducted, funded, and analyzed by G Ratings, a company incorporated in the state of Florida, USA, solely for informational purposes. It was neither commissioned nor funded by any pre-candidate, candidate, political campaign, or political party.